Lesson Plans
Modeling Plate Tectonics and Volcanoes
Overview
Students model Earth's tectonic plate movement and explore the relationship between these movements and different types of volcanoes.
This lesson has been adapted from the NASA Astro-Venture Geology Educator Guide, Lesson 5: Plate Tectonics and Volcanism. Publication number EG-2005-10-503-ARC. Much of the content is the same. The original lesson has been archived and can be accessed through NASA Wavelength.
“Plate Tectonics and Volcanism.” NASA Wavelength, NASA.
The full original lesson can be found here.
Materials Required
- Computer
- Internet
- Supplies for building models such as:
- Ooblick (1 part cornstarch and 1 part water) (to model asthenosphere)
- Plastic containers
- Pieces of plastic or bendable items (to model oceanic crust)
- Thicker items such as polystyrene (to model continental crust)
- Other items which students brainstorm
Procedure
Engage:
1. Show students pieces of a jigsaw puzzle or have them think of what puzzle pieces look like. Lead learners in a discussion about how puzzle pieces work.
- different shapes
- fit together in specific ways
- make a unique image when completed
2. Show them the image of Earth below and have them observe the shapes of the continents.
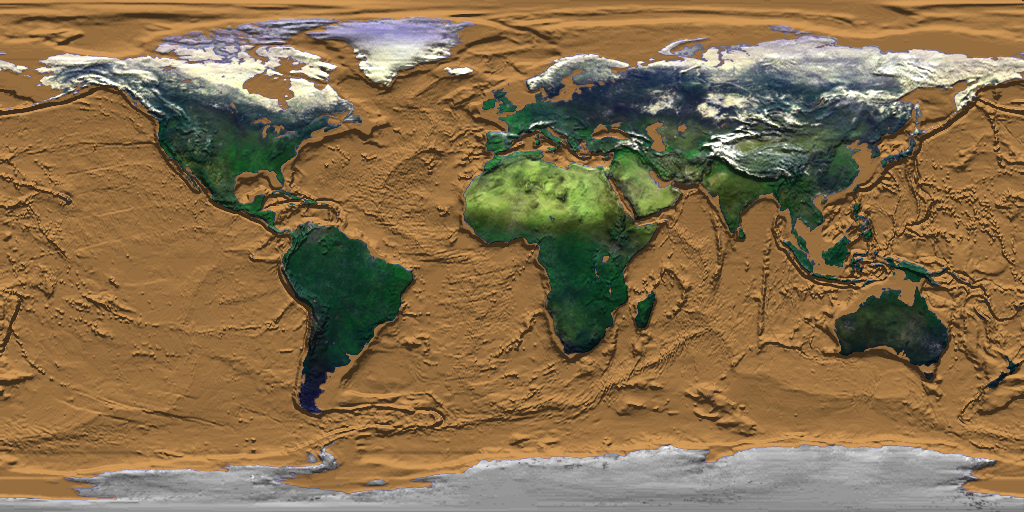
Lead a class discussion.
A. If you look at the world map and locate North America, what do you notice about the edges of the continent?
B. Now look at other continents on the world map. What do you notice about the other continents?
C. Looking at the world map, do you see any continents that you think South America would match up with like two jigsaw puzzle pieces? Explain your answer.
D. How do you think that the continents might have been arranged when they were all one continent?
3. Review Earth’s layers.
A. What are the compositional layers of Earth?
B. What are the mechanical layers of Earth?
C. What is the lithosphere?
D. Where is the asthenosphere?
E. What evidence do you know of that the lithosphere moves?
Explore:
-
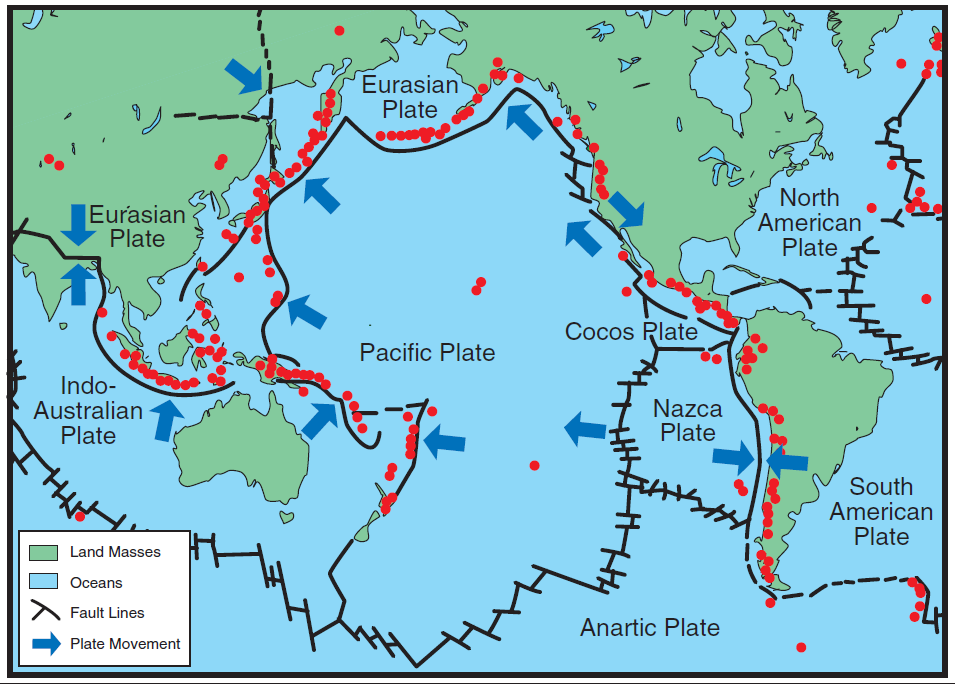
Display the map below and continue the class discussion.
Image Credit: USGS
A. What do you observe about this map?
B. What do the dark lines represent?
C. We learned that the lithosphere is broken into pieces? What are the pieces called?
2. Tell the students that the dark lines on the map represent the plate boundaries.
A. What observations can you make about the plates from this map?
B. What observations can you make about the plates related to the continents?
-
Teacher Note: If students are have difficulty with this, they can cut the maps out along the plate boundaries to see that plates include parts of the oceans and the continents.
3. Have students form a Hypothesis.
A. Where do you think volcanoes occur?
B. Have students mark on the maps where they think volcanoes occur. They should use a symbol to represent volcanoes.
C. Have students write statements explaining why they chose the locations they marked.
D. Discuss the predictions the students made.
4. Identify objectives
- Tell students that they are going to learn how movement within the Earth can result in major geologic events, such as volcanic eruptions.
- Tell students that questions they will be exploring are:
A. What is plate tectonics?
B What is the relationship between plate tectonics and volcanoes?
5. Observe where Volcanoes Actually Occur
A. Show students the Smithsonian National Museum of Natural History - Global Volcanism Program - Eruptions, Earthquakes and Emissions visualization of where volcanoes occur.
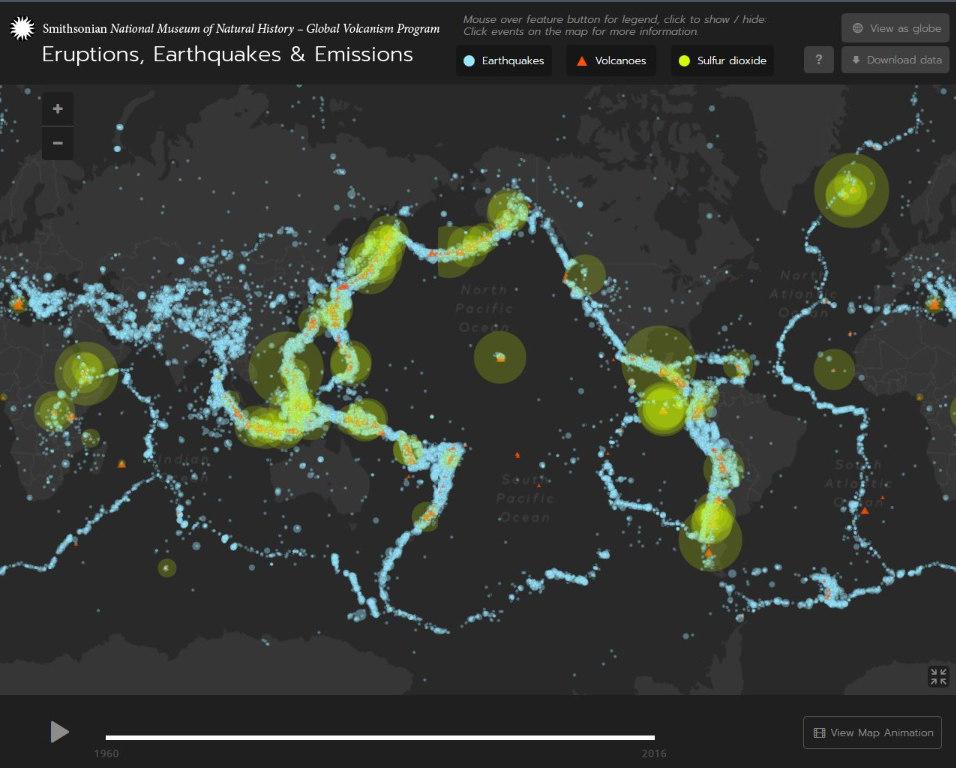
B. Have students write their answers to the following questions.
-
What observations do you have about the location of volcanoes?
-
What observations can you make about the relationship between volcanoes and plate boundaries?
6. Motion at plate boundaries
-
Lead students in demonstrating the motion that occurs at plate boundaries.
- Hold your hands out in front of you with the fingertips of each hand pointed towards each other and touching.
- Slowly push your fingertips together.
- If you continue pushing your fingertips together, what do you think your fingertips might do? (Accept reasonable responses. Answers may include that their fingertips might collide with each other.)
- Imagine that your hands represent two tectonic plates.
- Also, imagine that your left hand is denser than your right hand. The left hand, or more dense hand, represents the oceanic crust. The right hand, or less dense hand, represents the continental crust.
- What do you think “oceanic crust” means? (Oceanic crust has oceans above it.)
- What do you think continental crust means? (Continental crust is the crust that makes the continents.)
- If one of your hands/plates is denser than the other, what will happen when you push them together? (Allow students to share.)
- Remember that materials that are denser will sink under less dense materials. Therefore, the denser hand/plate should go under the less dense hand/plate.
- Have students hold their hands out again with the fingertips of each hand pointed toward each other and touching.
- Slowly push your fingertips together. (Students should show that the left-hand goes beneath the right hand as the two collide.)
- What do you think might happen when two tectonic plates collide? (Accept reasonable responses. Responses might include that a volcano will form when two plates collide.)
- When the oceanic crust sinks below the continental crust, this is called subduction. The area where it happens is called a subduction zone.
7. Let’s look at how this movement can occur and how it works with the tectonic plates.
A. Watch the NASA Space Place: Plate Tectonics video.
B. Ask the following questions.
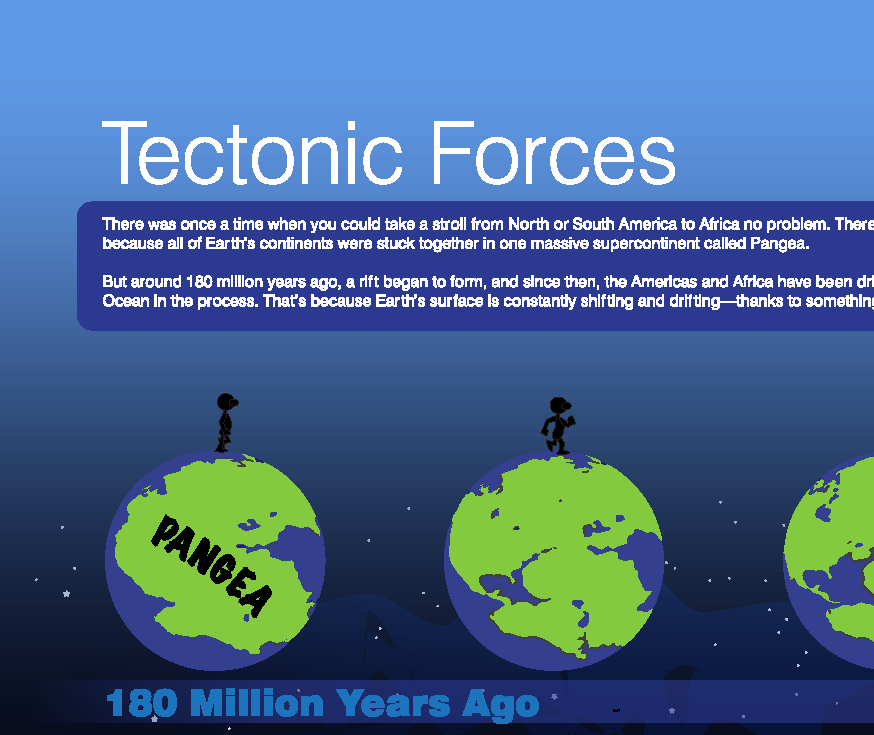
- What is the name of the supercontinent that began to break up about 180 million years ago? (Pangea)
- What happened when the Americans and Africa drifted apart? (The Atlantic Ocean formed)
- What causes Earth's tectonic plates to move? (Convection in the mantle)
- What happens when tectonic plates move apart at the bottom of the ocean? (New crust is formed and new oceans can be created.)
- Where does the creation of new oceanic crust occur? (mid-ocean ridges)
- Where is the old ocean floor destroyed or recycled? (subduction zones)
- As the continents keep moving, what do scientists think might happen? (Another supercontinent will form.)
8. Evaluate evidence.
A. Draw students' attention to the map below and ask the following questions:
-
Can you find any plate boundaries where two plates collide? (Accept reasonable responses. One example is the boundary between the Nazca Plate and the South American Plate.)
-
What features are located near this border? (volcanoes)
-
Do volcanoes always form when two plates collide? Can you find an example on the map where plates are colliding, but there are no volcanoes? (Volcanoes do not always form when plates collide. On the top left side where the Eurasian Plate collides with the Indo-Australian plate, there are no volcanoes.)
-
At the boundary between the Eurasian Plate and the Indo-Australian plate, neither plate went under the other. Instead, they collided and pushed each other up, forming the Himalayan mountains. This is a convergent boundary between continental crust and continental crust, called a continental-continental plate boundary.
-
-
Model other boundaries with hands.
- Use your hands to model this kind of boundary. (As their fingertips touch, they should push each other up, rather than sliding one hand under the other.)
- Hold your hands out in front of you again with the fingertips of each hand pointed in towards each other and touching.
- Slowly pull your hands apart.
- What do you think this demonstration represents? (It represents two plates moving apart from each other.)
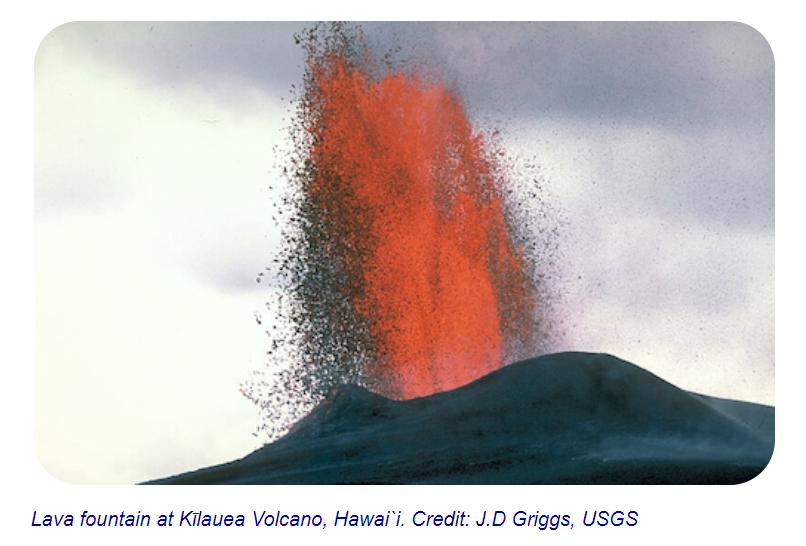
- When two plates move apart, it is called a divergent boundary. The decrease in pressure causes the magma to rise, forming volcanoes.
Explain:
Have students answer the questions and discuss their answers to the questions.
- What observations can you make about the relationship between plate boundaries and volcanoes? (Students should observe that most of the volcanoes are located on plate boundaries. Students should share ideas. )
- Why do you think most of the volcanoes occur at plate boundaries? (Students should respond that most volcanoes occur at plate boundaries because of the movement of the plates. Students should share ideas. )
- Explain where volcanoes are occurring on this map and why they are occurring at these locations in terms of plates and their movement. (Volcanoes occur where plates collide and where plates move apart.)
- Do you see volcanoes on the map that are not at plate boundaries? If so, where are these volcanoes located? (Yes, there are volcanoes that are not on plate boundaries. An example is the Hawaiian Islands.)
- These volcanoes occur in areas known as “hot spots.” A hot spot is a place where part of the mantle with a very high temperature rises through the lithosphere causing volcanic eruptions. Scientists are not sure exactly why or how this happens.
- At the beginning of this activity, you marked on a map where you thought volcanoes occurred. Look at your hypothesis/prediction.
- Where do volcanoes occur? (Have students share their answers with the class. Student answers should state that volcanoes occur where plates collide, where plates move apart, and in areas known as hot spots.)
Discuss plate movement with students.
-
Two of the places where volcanoes occur result from plates moving.
- How do the plates move? (Allow students to share their ideas. Use the following questions if students need more direction.)
- Plates are sections of what layer of the Earth? (Plates are sections of the lithosphere.)
- What layer of the Earth is under the lithosphere? (The asthenosphere is under the lithosphere.)
- How would you describe the asthenosphere? (The asthenosphere is a part of the upper mantle that is partially molten. It is what the lithosphere rides upon.)
- Because the asthenosphere is partially molten and denser than the lithosphere, the plates move on top of the asthenosphere at the rate of centimeters per year. This theory of the movement of the plates over the asthenosphere is called plate tectonics.
- Teacher Note: Students may ask what causes the plates to move. Scientists do not agree on the cause of plate tectonics. Some think that the convection of the mantle caused the plates to move, while others think that the lithosphere moves causing friction that heats up the mantle and causes the mantle to move.
- How fast do you think the plates move on top of the asthenosphere? (Accept reasonable responses.)
- The plates move at the rate of centimeters per year.
- This rate of centimeters per year is about the same rate as our fingernails grow and is the same rate as the rate of convection in the mantle.
Extend/Apply
1. Describe Plate Tectonics Activity
- In this lesson, you learned that the plates move on top of the asthenosphere. In this activity, you are going to design a model for plate tectonics.
- You will work in groups to develop a design that represents the movement of the plates.
- When developing your designs, think about how to correctly represent the layers of the Earth that are involved in plate movements.
- You will demonstrate your models to the class.
2. Assign Groups
- Your designs need to include a labeled picture that shows the materials used and the layers of the Earth represented.
- Use the page provided to document your plan. There should be one per group.
- Discuss your plan with your teacher before constructing your model.
- Construct your models the materials provided by the teacher or approved and brought in by students.
- Have a gallery walk through the different models.
Evaluate:
Students should answer the following questions.
- What is the Theory of Plate Tectonics? (Plate tectonics is the movement of the solid lithosphere plates over the partially molten asthenosphere.)
- What features of the models correctly represented plate tectonics? (Allow students to share their ideas. Students may respond that the models correctly represented that the plates move on top of another surface that is partially fluid and that oceanic crust is denser than continental crust. The model also shows that plates move apart and together and that volcanoes occur at both locations.)
- What improvements could be made to the models to make them more accurate? (Allow students to share their ideas. Students may respond that the models could be made to scale, materials that more accurately represent the lithosphere and asthenosphere could be used, a larger model could be made, and the model could be observed for a longer period of time.)
- How fast did plate tectonics occur in your model? (Accept all reasonable answers. Plate tectonics in the students’ models will most likely occur in a very short period of time.)
- What is the relationship between plate tectonics and volcanoes? Explain. (Volcanoes result from plate tectonics. Two of the places that volcanoes occur are where plates collide and where plates move apart.)
- Evaluate student responses to find evidence of mastery of the following ideas.
- The solid crust and upper mantle of the Earth - including both continental and oceanic crust - consist of separate sections that overlie a hot, partially molten area. These sections are called tectonic plates.
- The separate crustal plates move on this molten layer at rates of centimeters per year, colliding in some places, pulling apart in others.
- The Earth’s crust and upper mantle (together called the lithosphere) move at the same rate as mantle convection. Volcanoes occur where plates collide, move apart and are areas known as “hot spots.”
- Plate tectonics involves the lithosphere moving over the asthenosphere.
Disciplinary Core Ideas:
- ESS2A: Earth Materials and Systems
Crosscutting Concepts:
- Cause and Effect
Science and Engineering Practices:
- Developing and Using Models
Students create a model of plate tectonics and explain the factors that control the locations of volcanoes.
- What is plate tectonics?
- What is the relationship between plate tectonics and volcanoes?
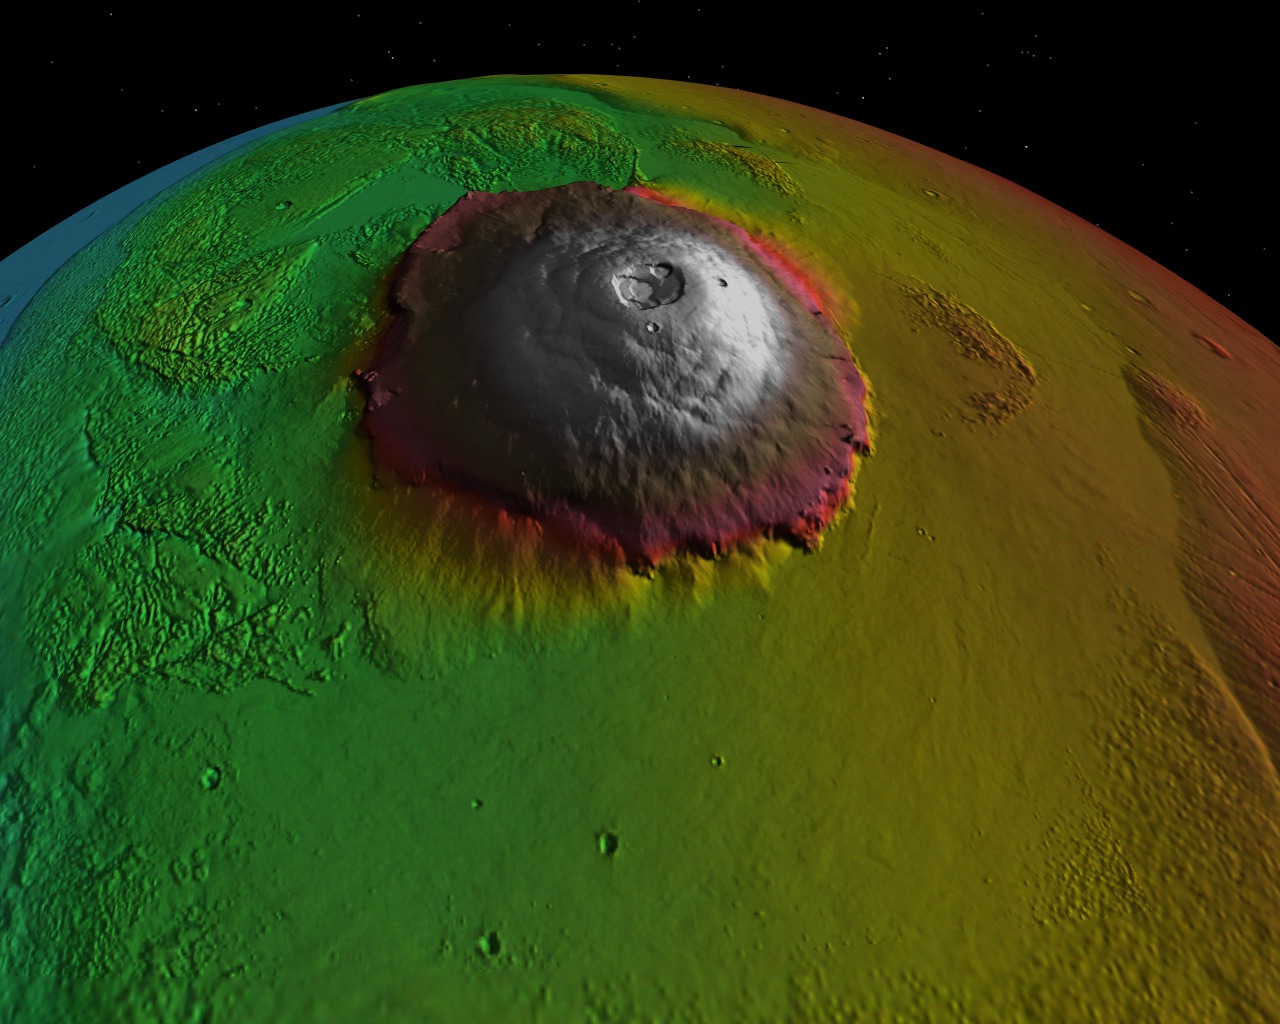
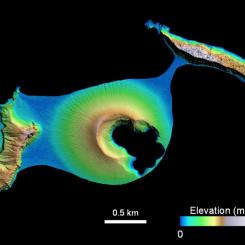
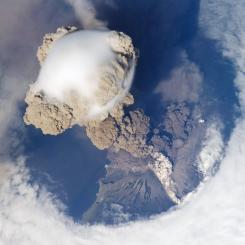
Volcanoes are windows into the interior of the Earth. Through subtle changes and dramatic explosions, they intrigue scientists and often strike fear into societies. Lava flows, pyroclastic flows, and lahars pose great risk to those living in the proximity of a volcano, while large explosive eruptions can affect the entire planet by filling the atmosphere with ash and sulfate particles thereby modify the global climate.
Explosive volcanic eruptions pose both short-term and long-term hazards. Lava flows and lahars can wipe out the flanks of mountainsides. Volcanic ash can blanket the landscape for miles, and ash clouds can disrupt aircraft travel, such as the incident in 1989 when ash from Alaska's Redoubt volcano temporarily disabled a passenger airplane. On longer time scales, eruptions can inject massive quantities of ash into the atmosphere, greatly reducing the solar heating of the Earth and potentially interrupting the global food supply for several years.
The eruptive power and often long intervals of quiet dormancy of volcanoes make them both difficult to study, and difficult to live near. The threat of eruption is always there, but because eruptions are temporally episodic and distributed around the globe, we must rely on methods that give us observations of volcanic activity globally.
Evans, Diane, et al. “Solid Earth Science Working Group (SESWG).” NASA, NASA, 5 Feb. 2013, solidearth.jpl.nasa.gov/PAGES/volc01.html.
Students should be familiar with the following concepts:
- The compositional layers of the Earth are the crust, mantle and core.
- The mechanical layers of Earth are the brittle, rigid lithosphere, partially molten asthenosphere, solid mantle, liquid outer core, and solid inner core.
- The lithosphere is composed of the crust and upper part of the mantle.
- The asthenosphere is below the lithosphere and that it is the partially molten part of the mantle.
- Movement inside Earth occurs in the lithosphere, mantle and outer core.
- Materials rise and sink due to differences in density which can be caused by changes in temperature or pressure.
- All volcanoes are explosive.
- All mountains are volcanoes.
- Volcanic eruptions are chemical reactions.
- Mountains don’t move.
More than 1,500 potentially active volcanoes dot the Earth’s landscape, of which approximately 500 are active at any given time. Although scientists keep watch over many of the Earth’s volcanoes using traditional ground observation methods, satellite-based remote sensing is quickly becoming a crucial tool for understanding where, when, and why the Earth’s volcanoes periodically boil over.
Satellite technology now makes it possible to monitor volcanic activity in even the most isolated corners of the globe, and to routinely observe changes in the Earth’s surface that may signal an impending eruption. In addition, remote sensing data offer scientists the chance to prevent catastrophic damage to life and property by determining how and where volcanic debris spreads after an eruption.
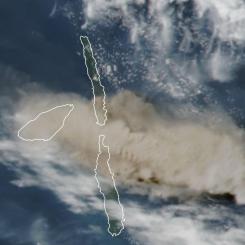
The MODIS Thermal Alert System, known as MODVOLC, which now enables scientists to detect volcanic activity anywhere in the world within hours of its occurrence. MODVOLC uses data acquired by the Moderate Resolution Imaging Spectroradiometer (MODIS) sensors, which fly aboard NASA’s Terra and Aqua satellites. “The algorithm we’ve developed scans each 1-kilometer pixel within every MODIS image to see if it contains high-temperature heat sources, or hot spots. These heat sources may be active lava flows, lava domes, or lava lakes. Since MODIS achieves complete global coverage every 48 hours, this means that our system checks every square kilometer of the globe for volcanic activity once every two days,” said Dr. Robert Wright, a research scientist at the Hawaii Institute of Geophysics and Planetology (HIGP).
Although scientists will continue to use ground monitoring techniques to keep an eye on the Earth’s volcanoes, satellite data will increasingly allow scientists to see “the big picture” and, as a result, better predict volcanic activity.
Schmidt, Laurie J. “Sensing Remote Volcanoes | Earthdata.” NASA, NASA, 14 May 2019.
- Geotechnical Engineer - A geotechnical engineer is a type of civil engineer who focuses on the mechanics of the land, rocks, and soils in the building process. This type of engineering includes, but is not limited to, analyzing, designing, and constructing foundations, retaining structures, slopes, embankments, roadways, tunnels, levees, wharves, landfills, and other systems that are comprised of rock or soil.
- Data Visualizer - At the core of scientific visualization is the representation of data graphically - through images, animations, and videos - to improve understanding and develop insight. Data visualizers develop data-driven images, maps, and visualizations from information collected by Earth-observing satellites, airborne missions, and ground measurements. Visualizations allow us to explore data, phenomena and behavior; they are particularly effective for showing large scales of time and space, and "invisible" processes (e.g. flows of energy and matter) as integral parts of the models.
- Remote Sensing Specialist - Remote sensing scientists use sensors to analyze data and solve regional, national and global concerns. For instance, natural resource management, urban planning, and climate and weather prediction are applications of remote sensing. Many scientists develop new sensor systems, analytical techniques, or new applications for existing systems. They also work to develop and build databases for remote sensing or geospatial; meaning relating to or denoting data that is associated with a particular location, project information. Remote sensing scientists also process aerial or satellite imagery to create products like land cover maps.
- Internet Required