STEM Career Connections
TECHNOLOGY: Data Visualization

Work Description
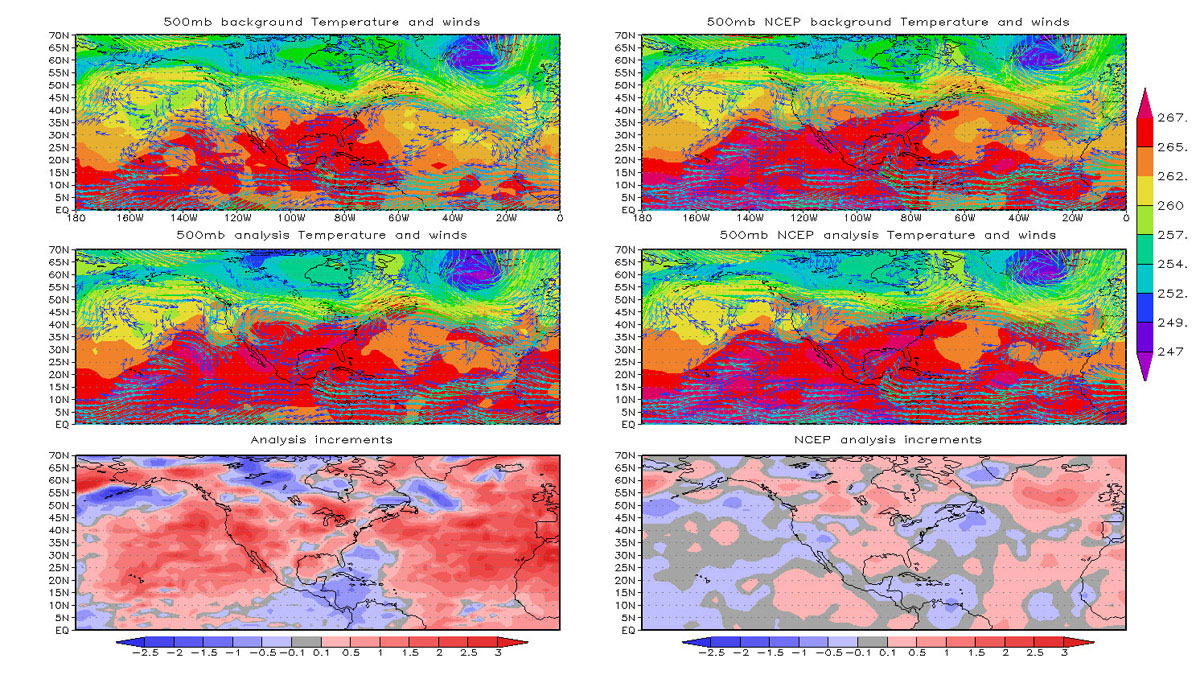
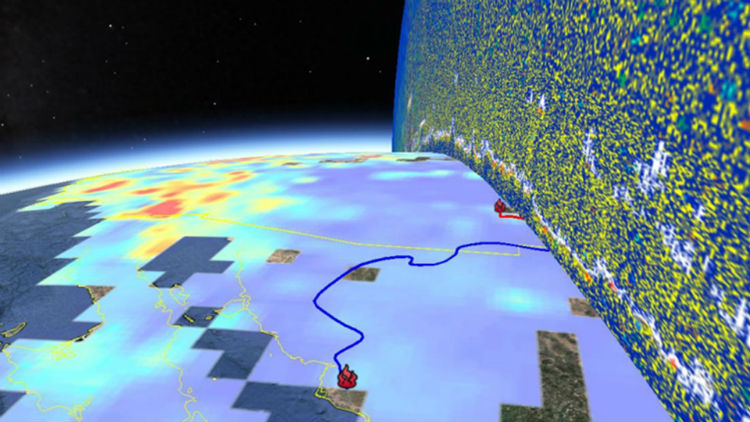
At the core of scientific visualization is the representation of data graphically - through images, animations, and videos - to improve understanding and develop insight. Data visualizers develop data-driven images, maps, and visualizations from information collected by Earth-observing satellites, airborne missions, and ground measurements. Visualizations allow us to explore data, phenomena and behavior; they are particularly effective for showing large scales of time and space, and "invisible" processes (e.g. flows of energy and matter) as integral parts of the models.
Education
Date visualizers require a bachelor's and master’s degree (or equal professional experience) in computer science, maths, cartography, GIS, design or comparable major and 5 years of professional experience in data visualization/design. Visualization jobs are often a component of data analyst or data scientist roles.
NASA Connections
Job Title NASA Examples:
- Data Visualizer
- Data Modeling Analyst
- Data Scientist
NASA Career Links:


