Lesson Plans
Which Eruption was Larger? A Data Expedition
Overview
Students will explore NASA resources to understand the aerosol hazards associated with volcanoes, as well as compare the aerosols associated with two distinctly different volcanoes in 2018.
Materials Required
- Student Sheets
- Kilauea 2018 Monthly Sulfur Dioxide Images
- Kilauea 2018 Monthly Aerosol Images
- Kilauea 2018 Monthly Aerosols Graph
- Kilauea 2018 Sulfur Dioxide Graph
- Claim Evidence Reasoning Document with Rubric
Procedure
Developing Our Understanding
Section 1: Watch the NASA video: Fire, Ice, and Safer Skies: NASA Satellites Track Volcanic Clouds which describes hazards of volcanic emissions. Answer the questions on the Student Sheets about the video.
- Why are volcanic emissions a problem?
- What is NASA tracking to try to help predict emissions?
Section 2: Watch NASA's Earth Minute: My Name is Aerosol and answer the following questions on the Student Sheets.
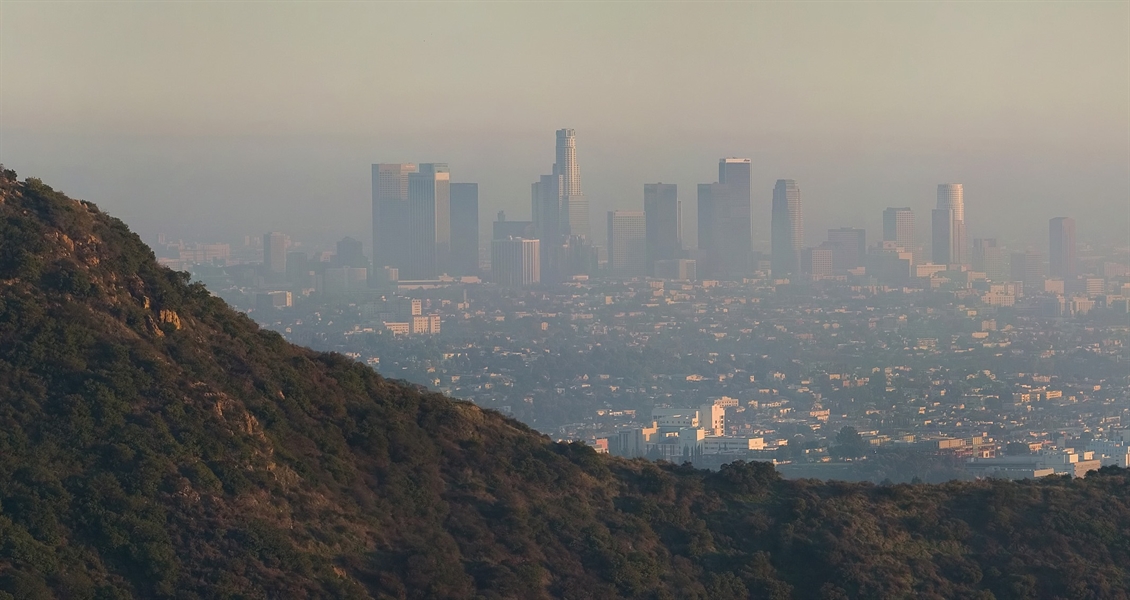
- Identify different sources of aerosols.
- What are the effects of aerosols?
- How does NASA study aerosols?
- Why does NASA study aerosols?
- If there are so many different sources of aerosols, how can we know that aerosols we are seeing in data are from a volcano?
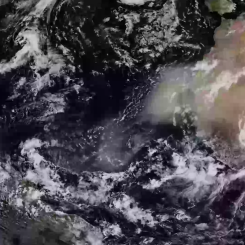
Section 3: Watch the following animation featuring aerosols near Kilauea, Hawaii in 2018 and answer the following animation questions.
- Did you see any noticeable change over the course of 2018 in aerosols? Describe the range of data values.
- What might have caused this?
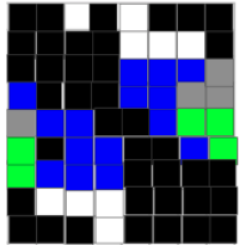
Section 4: Now, view the animation below showing a satellite's view of sulfur dioxide data near Kilauea, Hawaii in 2018. Sulfur dioxide is a particular kind of aerosol commonly associated with volcanoes. Answer the following questions.
- What was the trend over the course of the year?
- What months do you think experienced the most emissions?
- Provide at least two pieces of evidence for your answer to the last question?
Section 5: Pooling Data to See the Big Picture
Analyze both line graphs:
- What new insights do the line graphs offer that the animations do not?
- What is the benefit of using line graphs for these kinds of data?
- What can you claim about the aerosols during 2018 for Hawaii?
- What can you claim about the SO2 during 2018 for Hawaii?
- What can you not claim about these data values?
Applying Your Understanding
Overview of the Project
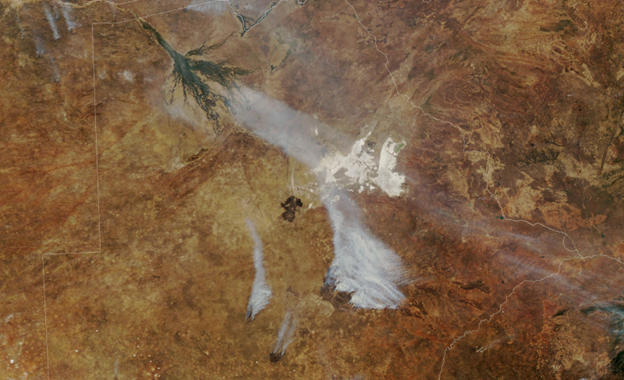
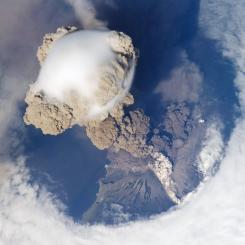
Students: Imagine this...You are studying volcanoes and have learned about the 2018 Kilauea volcano in Hawaii. Some of your classmates say it was the biggest eruption in 2018, but you read online that there was a larger eruption in 2018 on an Island in the South Pacific somewhere that you later learn is Ambae Island on the island nation of Vanuatu. Your teacher has offered your choice of a week without homework or 15 bonus points on a test for the first student to prove their claim using data with evidence and explain their reasoning.
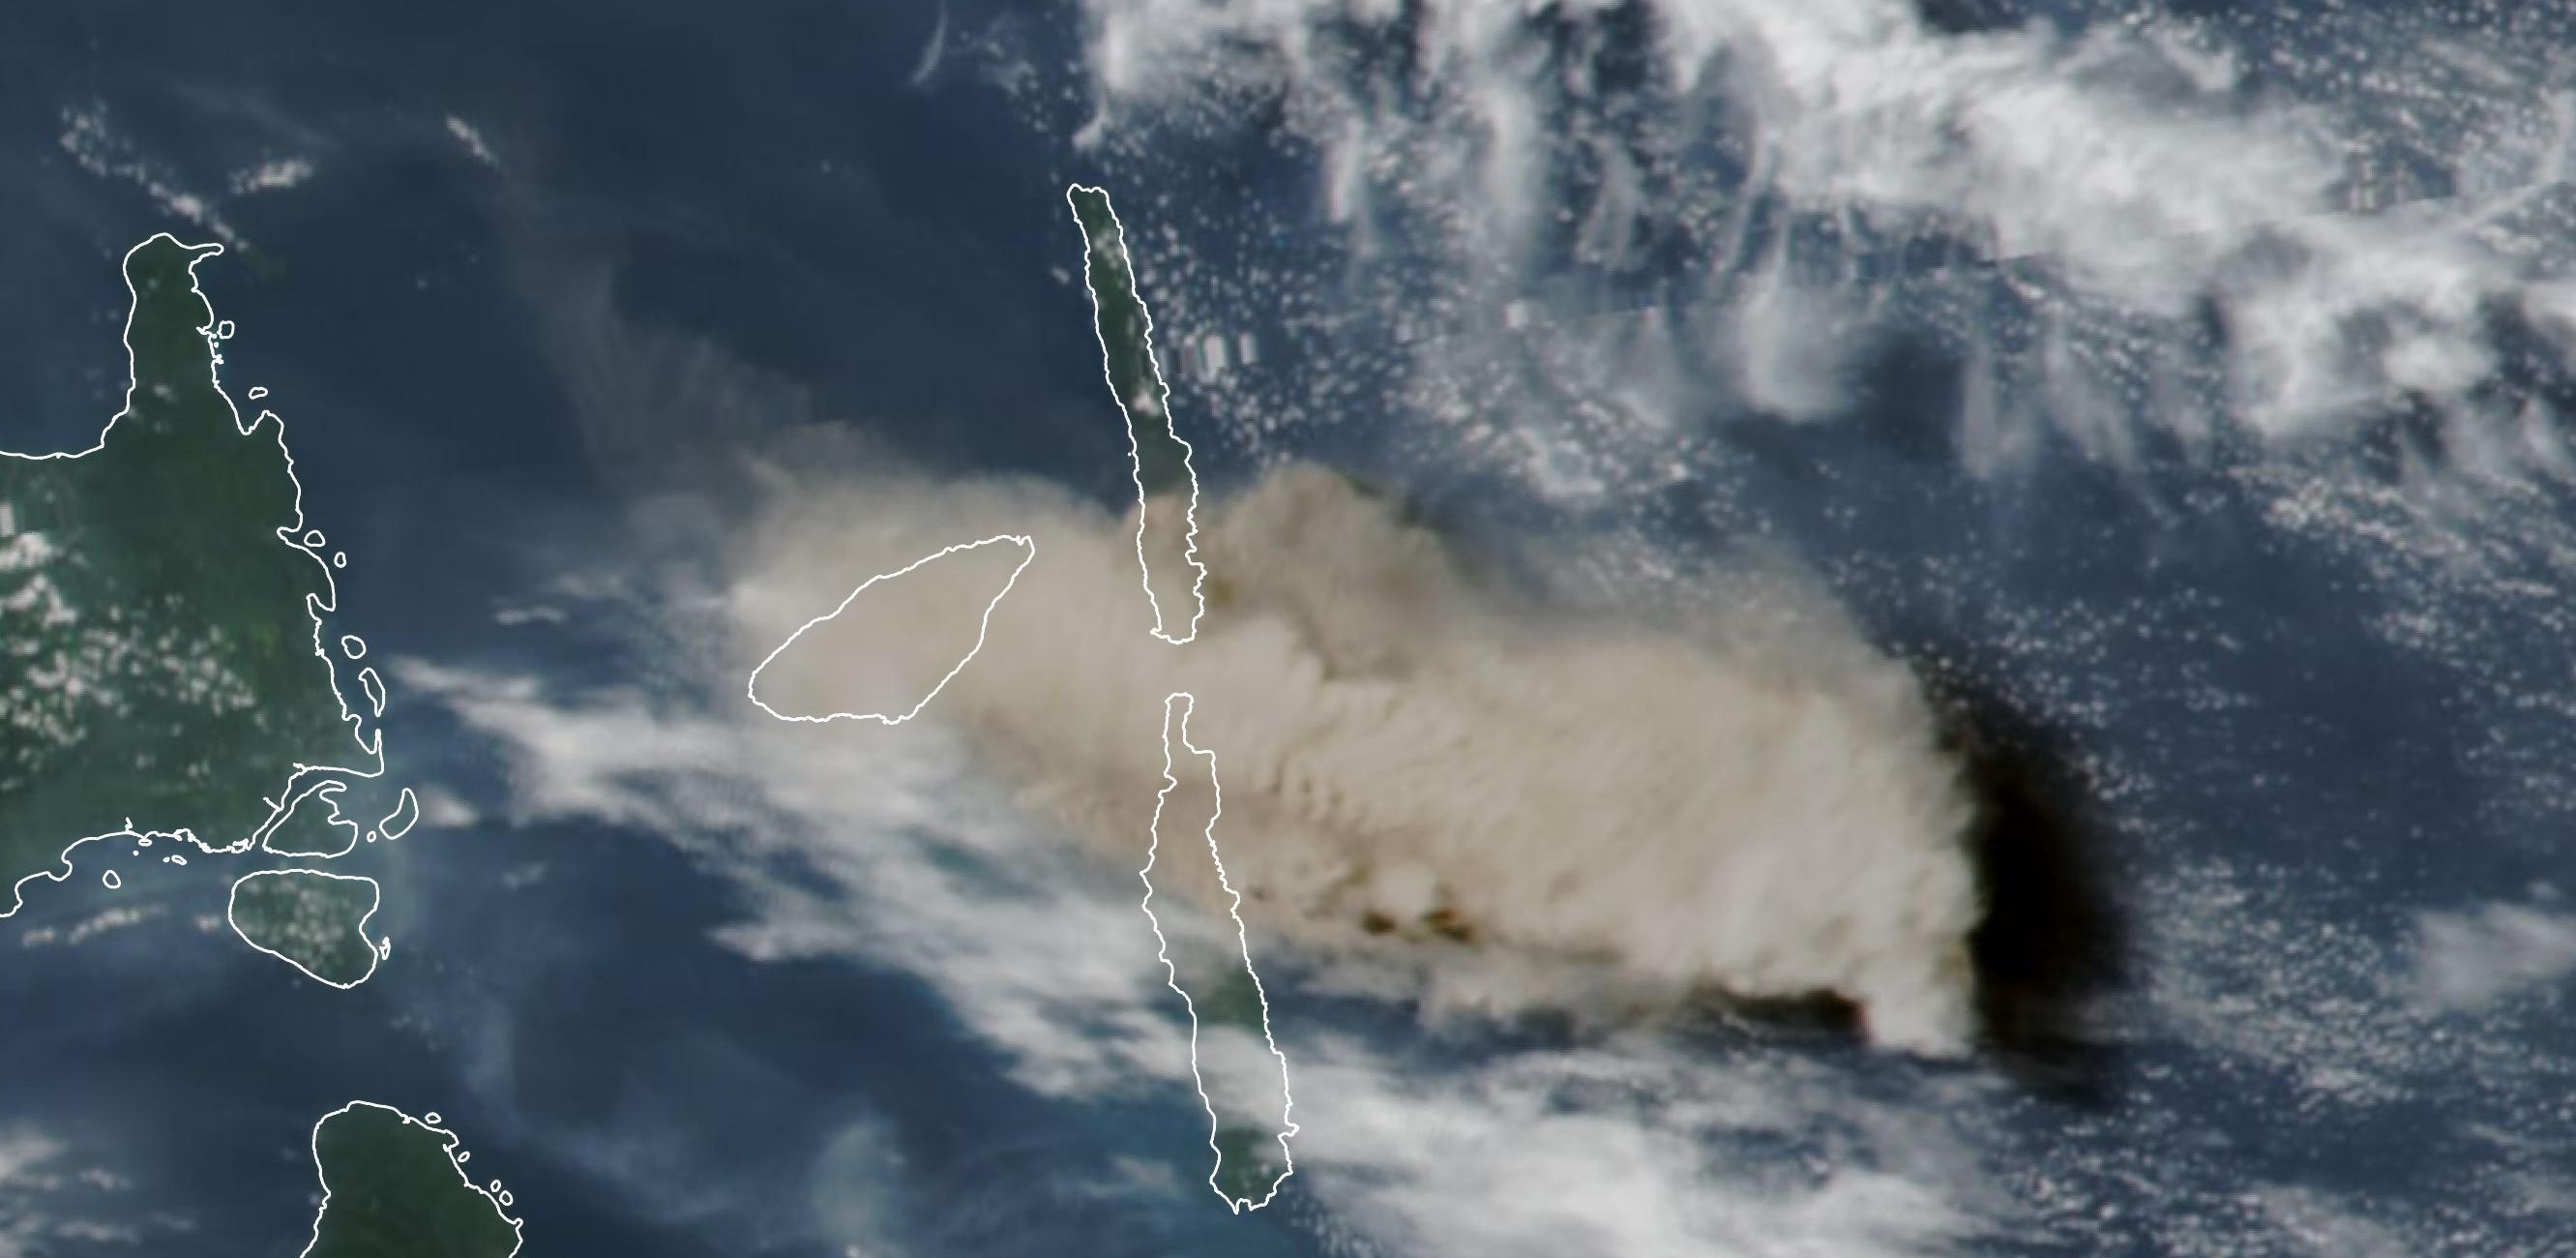
Credit: NASA Earth Observatory/Lauren Dauphin
You want to earn the prize from the teacher but the online source you read didn’t have any data. You have decided to explore NASA resources to learn more about volcanoes and use the My NASA Data Earth System Data Explorer to find some data, draw a conclusion, and make an argument to support the conclusion.
Your Task:
- You will research the aerosol and SO2 data for the 2018 Ambae Island eruption using the Earth System Data Explorer to access these same data. NOTE: Review the Youtube videos to learn how to use the Earth System Data Explorer.
- Watch the tutorial "Getting Started with the Earth System Data Explorer".
- Analyze the data for both volcanoes to draw a conclusion.
- Make a claim to identify the volcano with the largest eruption in 2018 and construct an argument for your conclusion.
- Complete a claim-evidence-reasoning document (see Google Slide) to support your argument.
Collect Evidence about the Ambae Island Volcano
-
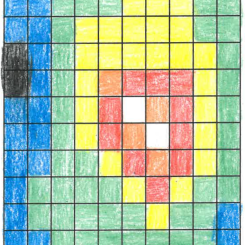
Use the map and the following coordinates to help create a map of this region in the Earth System Data Explorer. Ambae Island is located at 15.39 S and 167.82 E.
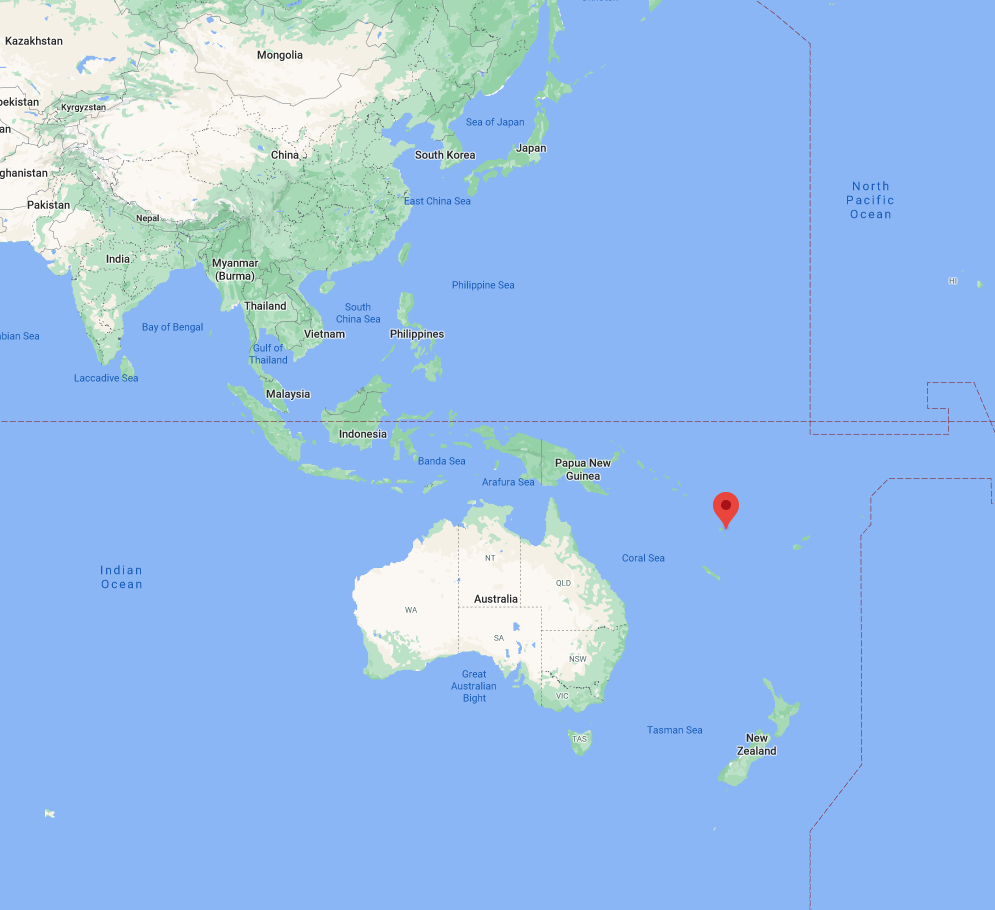
Map of the general location of Ambae Island. Credit: Google Maps - Create a line graph and mapped monthly images for both datasets for Ambae Island in 2018. These datasets can be found under the Atmosphere in the Aerosols category. Select the datasets: 1.) Monthly Aerosol Optical Depth and 2.) Monthly Air Column Concentration of SO2.
Analyzing the Ambae Eruption Data
Review the maps and the line graphs for Monthly Aerosol Optical Depth and Monthly Air Column Concentration of SO2 data.
- Which month do you think had the most volcanic activity?
- What evidence do you have to support your answer?
Comparing Volcanic Eruptions for 2018
Now compare Ambae Eruption Data with data from Kilauea, Hawaii.
- How do the mapped images compare for the months of volcanic activity? (Compare the eruption month for Kilauea to the eruption month for Ambae.)
- How do the graphs compare for the months of volcanic activity? (Compare the eruption month for Kilauea to the eruption month for Ambae.)
- Which eruption do you think was larger?
- Do the images and graphs both support your conclusion? Explain.
- Which type of evidence is the most precise?
Support your Claim with Evidence
- Complete the Claim-Evidence-Reasoning table in the Google Slide.
- The rubric used for evaluation is included with the Claim-Evidence-Reasoning table.
Disciplinary Core Ideas:
- ESS2B: Plate Tectonics and Large-Scale Systems
Crosscutting Concepts:
- Cause and Effect
Science and Engineering Practices:
- Analyzing and Interpreting Data
- Using Mathematics and Computational Thinking
- Constructing Explanations and Designing Solutions
- Engaging in Argument from Evidence
- Analyze data to find evidence of volcanic activity.
- Analyze more than one data source for evidence of activity.
- Make a claim based on evidence of which eruption was larger.
- Explain the evidence and reasoning used to make a claim.
- Which eruption was larger?
- What evidence do you have to support your claim?
- Ability to read a line graph
- Understanding of latitude and longitude
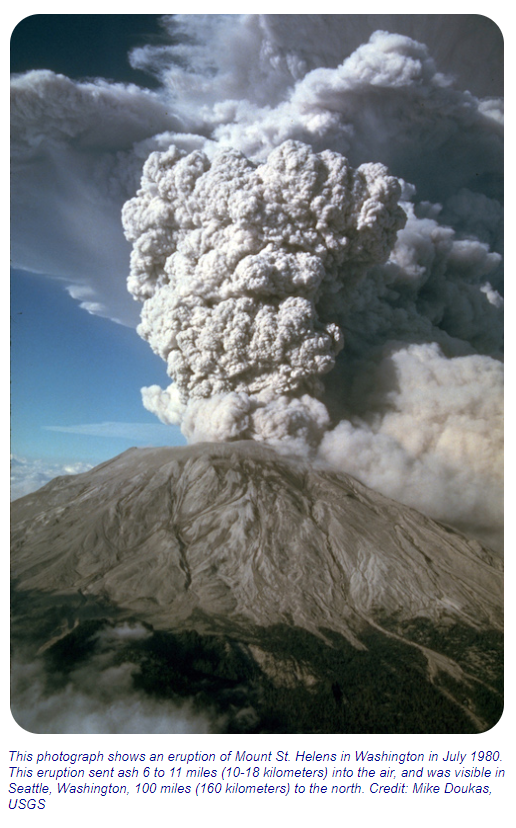
Students may think that all volcanoes erupt violently.
Source: Ohio State University
NASA Getting the Big Picture
NASA uses satellites for many different purposes. Watch NASA's video Getting the Big Picture for general information.
Source: NASA Goddard
About the NASA Disasters Program
The Disasters Applications area promotes the use of Earth observations to improve prediction of, preparation for, response to, and recovery from natural and technological disasters. Disaster applications and applied research on natural hazards support emergency preparedness leaders in developing mitigation approaches, such as early warning systems, and providing information and maps to disaster response and recovery teams.
Source: Earth Science Applied Sciences
In order to accomplish these goals, satellite data are used. To study volcanoes, multiple instruments on satellites are used. Those highlighted in this lesson are the OMI and MISR instruments.
About OMI
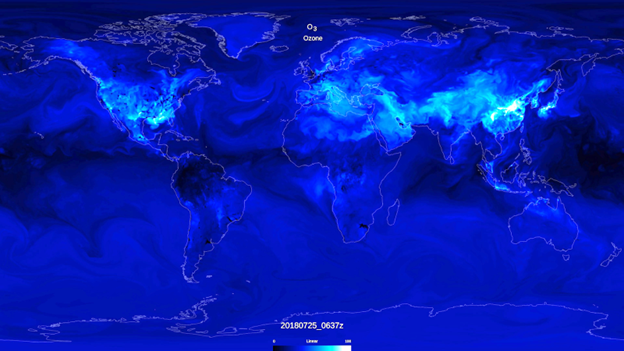
The Ozone Monitoring Instrument (OMI) instrument can distinguish between aerosol types, such as smoke, dust, and sulfates, and measures cloud pressure and coverage, which provides data to derive tropospheric ozone.
OMI continues the TOMS record for total ozone and other atmospheric parameters related to ozone chemistry and climate. OMI measurements are highly synergistic with the other instruments on the Aura platform.
The OMI instrument employs hyperspectral imaging in a push-broom mode to observe solar backscatter radiation in the visible and ultraviolet. The hyperspectral capabilities improve the accuracy and precision of the total ozone amounts and also allow for accurate radiometric and wavelength self calibration over the long term.
The instrument is a contribution of the Netherlands's Agency for Aerospace Programs (NIVR) in collaboration with the Finnish Meteorological Institute (FMI) to the Aura mission.
Source: Ozone Monitoring Instrument (OMI)
MISR
This instrument is aboard the NASA Terra Satellite launched on December 18, 1999.
Most satellite instruments look only straight down, or toward the edge of the planet. To fully understand Earth’s climate, and to determine how it may be changing, we need to know the amount of sunlight that is scattered in different directions under natural conditions. MISR is a new type of instrument designed to address this need — it views the Earth with cameras pointed at nine different angles. One camera points toward nadir, and the others provide forward and afterward view angles, at the Earth’s surface, of 26.1°, 45.6°, 60.0°, and 70.5°. As the instrument flies overhead, each region of the Earth’s surface is successively imaged by all nine cameras in each of four wavelengths (blue, green, red, and near-infrared).
In addition to improving our understanding of the fate of sunlight in the Earth’s environment, MISR data can distinguish different types of clouds, aerosol particles, and surfaces. Specifically, MISR will monitor the monthly, seasonal, and long-term trends in:
- the amount and type of atmospheric aerosol particles, including those formed by natural sources and by human activities;
- the amount, types, and heights of clouds; and
- the distribution of land surface cover, including vegetation canopy structure
Geotechnical Engineer - A geotechnical engineer is a type of civil engineer who focuses on the mechanics of the land, rocks, and soils in the building process. This type of engineering includes, but is not limited to, analyzing, designing, and constructing foundations, retaining structures, slopes, embankments, roadways, tunnels, levees, wharves, landfills, and other systems that are comprised of rock or soil.
Data Visualizer - At the core of scientific visualization is the representation of data graphically - through images, animations, and videos - to improve understanding and develop insight. Data visualizers develop data-driven images, maps, and visualizations from information collected by Earth-observing satellites, airborne missions, and ground measurements. Visualizations allow us to explore data, phenomena and behavior; they are particularly effective for showing large scales of time and space, and "invisible" processes (e.g. flows of energy and matter) as integral parts of the models.
Remote Sensing Specialist - Remote sensing scientists use sensors to analyze data and solve regional, national and global concerns. For instance, natural resource management, urban planning, and climate and weather prediction are applications of remote sensing. Many scientists develop new sensor systems, analytical techniques, or new applications for existing systems. They also work to develop and build databases for remote sensing or geospatial; meaning relating to or denoting data that is associated with a particular location, project information. Remote sensing scientists also process aerial or satellite imagery to create products like land cover maps.
- Internet Required
Complementary Lesson Plans
Complementary Mini Lessons
Complementary Interactives


Grade Band
- 6-8
- 9-12
Time
- 50 minutes
Visualization Tool
NGSS Three Dimensional Learning
- See drop-down menu at the bottom of the page