Information from satellites is often used to display information about objects. This information can include how things appear, as well as their contents. Explore how pixel data sequences can be used to create an image and interpret it.
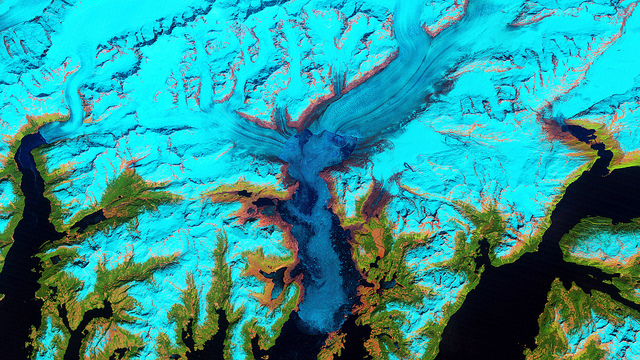
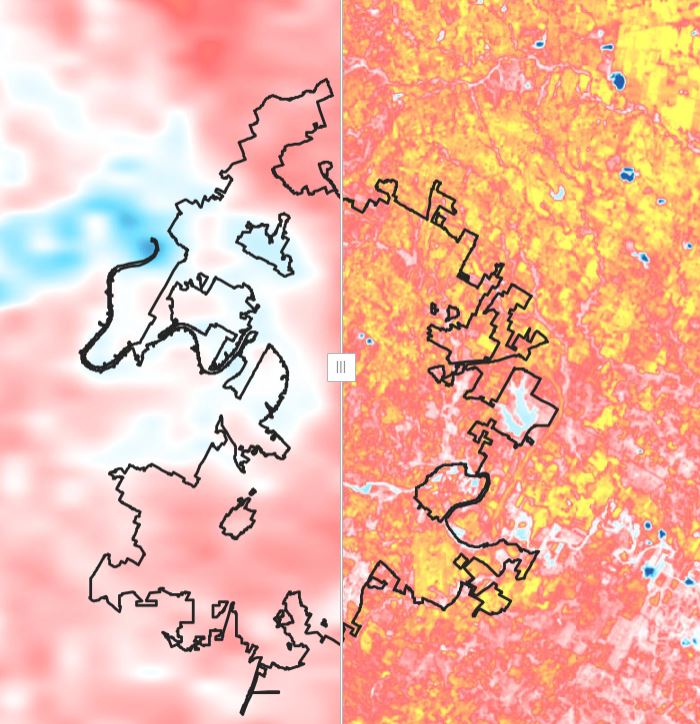
This false-color image, captured by the Thematic Mapper (TM) instrument on Landsat 5, shows Alaska's Columbia Glacier and the surrounding landscape in 2011. Instruments can measure different wavelengths in the electromagnetic spectrum.
Some of these wavelengths, or bands, are not in the visible spectrum but can provide useful information. Band combinations and shades in this Landsat image were selected to highlight Alaskan landscape.
By obtaining images of the same place using different filters on the sensor for different wavelengths, scientists can identify the specific 'colors' of hundreds of different surface features.
Let's see how this works! Snow and ice appear bright greenish-blue color, vegetation is green, clouds are white or light orange, and the open ocean is dark blue. Exposed bedrock is brown, while rocky debris on the glacier’s surface is gray.
Array Tables
An array table is a way to visualize and organize data
Numbers from a data set are input sequentially from left to right, then continuing to the next row, also from left to right.
Below is an example data set and its translation into a 4 column, 3 row array table.
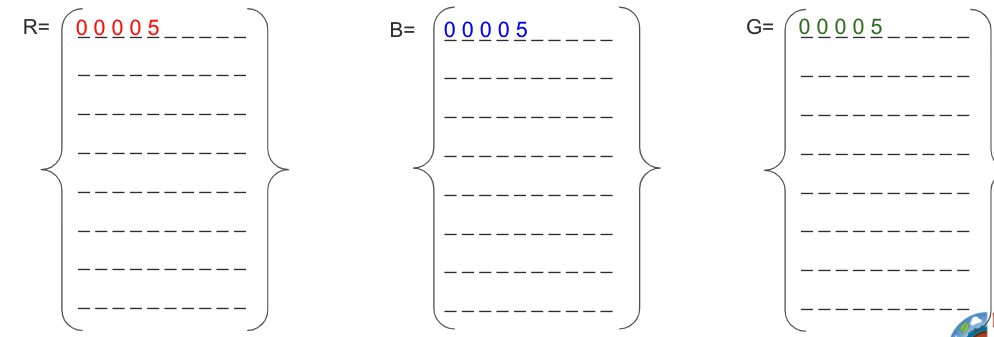
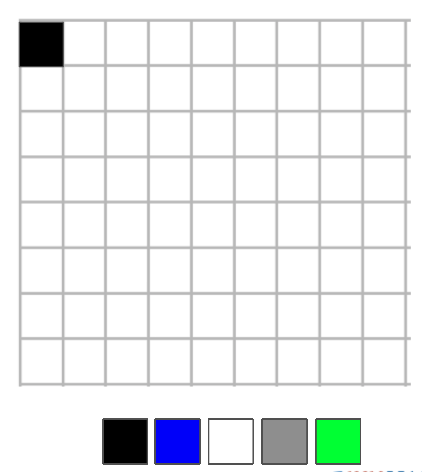
Suppose that you are an astronomer, and you have the first image of a planet orbiting another star. The satellite image of the planet's surface is shown in pixels an 8 (rows) x 9 (columns) grid. Images were obtained in three different color filters: Red, Green and Blue, so that surface features can be classified as water, land, snow, or vegetation.
The pixel data sequences for the three tables used to make the "satellite" image are shown below:
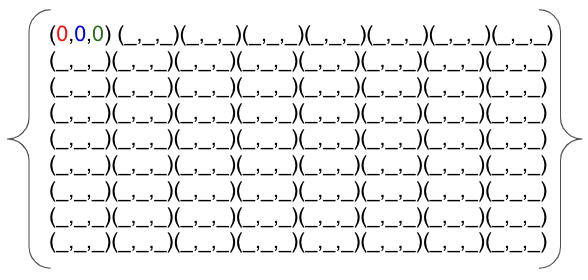
Use the array tables you created in Step 1 to form a combined array table of coordinates. Input the numbers from the same relative position in each table to find the coordinates for the sequenced positions. See the example below for the first set of coordinates. Note: the colors of the data values in the example below are for visual aid only. Students do not need to color their combined coordinates.
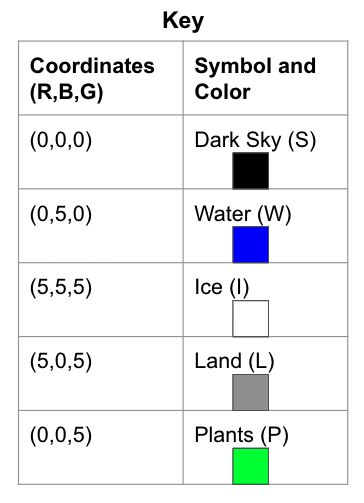
Using the key, shade in the associated color of the coordinate using the squares (shown at the bottom of the grid) in each pixel. It is possible in Google Slides Edit mode (not Present mode) where you can change the content on the slide to drag and drop the squares to the pixels.
Teachers who are interested in receiving the answer key, please complete the Teacher Key Request and Verification Form. We verify that requestors are teachers prior to sending access to the answer keys as we’ve had many students try to pass as teachers to gain access.