Lesson Plans
Human Health & Air Quality
Overview
In this 5Es lesson, students will uncover how changes in global air quality have impacted human health in cities between 2000 and 2019. They will begin by analyzing figures from a NASA Earth Observatory Series titled, No Breathing Easy for City Dwellers. Then, they will go on to read the articles where these figures were sourced. As they explore new resources, they will record evidence on a Claims, Evidence, Reasoning (CER) Organizer. By the end of the lesson, students will use their CER Organizer to write a constructed response that answers the essential question, Between 2000 and 2019, how have changes in air quality impacted human health in cities across the globe?
Source:
Pratt, S. E. (2022, March 14). No Breathing Easy for City Dwellers: Particulates. NASA Earth Observatory. Retrieved August 12, 2022, from https://earthobservatory.nasa.gov/images/149580/no-breathing-easy-for-c…
Materials Required
Materials Per Group:
- 1 dime
- 1 quarter
- 1 straw section
- U.S. Cities Map and Population Data
- Color printed PM 2.5 Images (1 per group plus a few extras of each image)
- Color printed Nitrogen Dioxide Images (1 per group plus a few extras of each image)
- CER Organizer (1 per student)
- NASA Earth Observatory Particulates Article
- NASA Earth Observatory Nitrogen Dioxide Article
Procedure
Engage:
Teacher Prep: Cut a straw into 1 inch sections (1 section per group)
Materials Per Group:
- 1 dime
- 1 quarter
- 1 straw section
- U.S. Cities Map and Population Data
Student Task: You will draw circles around each of the cities on this U.S. Cities Map to show the relative population.
- Look at the populations of each of the cities. Create a key to show the range in population for cities with small, medium, and large populations. Make sure that there is even spacing in your key.
- Place the quarter on each of the cities that you have determined have “large populations.” Trace around the quarter.
- Place the dime on each of the cities that you have determined have “medium populations.” Trace around the dime.
- Hold the straw above the cities which you have determined have “small populations.” Trace around the circular part of the straw.
Check for Understanding:

SAY: “Let’s look at an example of this type of population map before we begin.”
Teacher asks, “Describe what the different size circles show us on the map. How do you know what the size of the circles indicates?”
SAY: “We will use the same method to show populations of U.S. Cities.”
Explore:
SAY: “This map shows us relative populations of cities based on the size of the circles. But, the colors of the circles have meaning as well. They show us metrics related to air pollution and human health.”
As a whole class, watch ClimateBits: Unhealthy Air.
Direct students to jot down notes about the connections between air pollution and human health.
After the video, call on 2-3 students to share out.
Observe & Interpret:
Teacher Prep:
- Color print PM 2.5 Images and Nitrogen Dioxide Images and put them in separate plastic sheet protectors (1 per group plus a few extras of each image)
- Print CER Organizer (1 per student)
Practice as whole class:
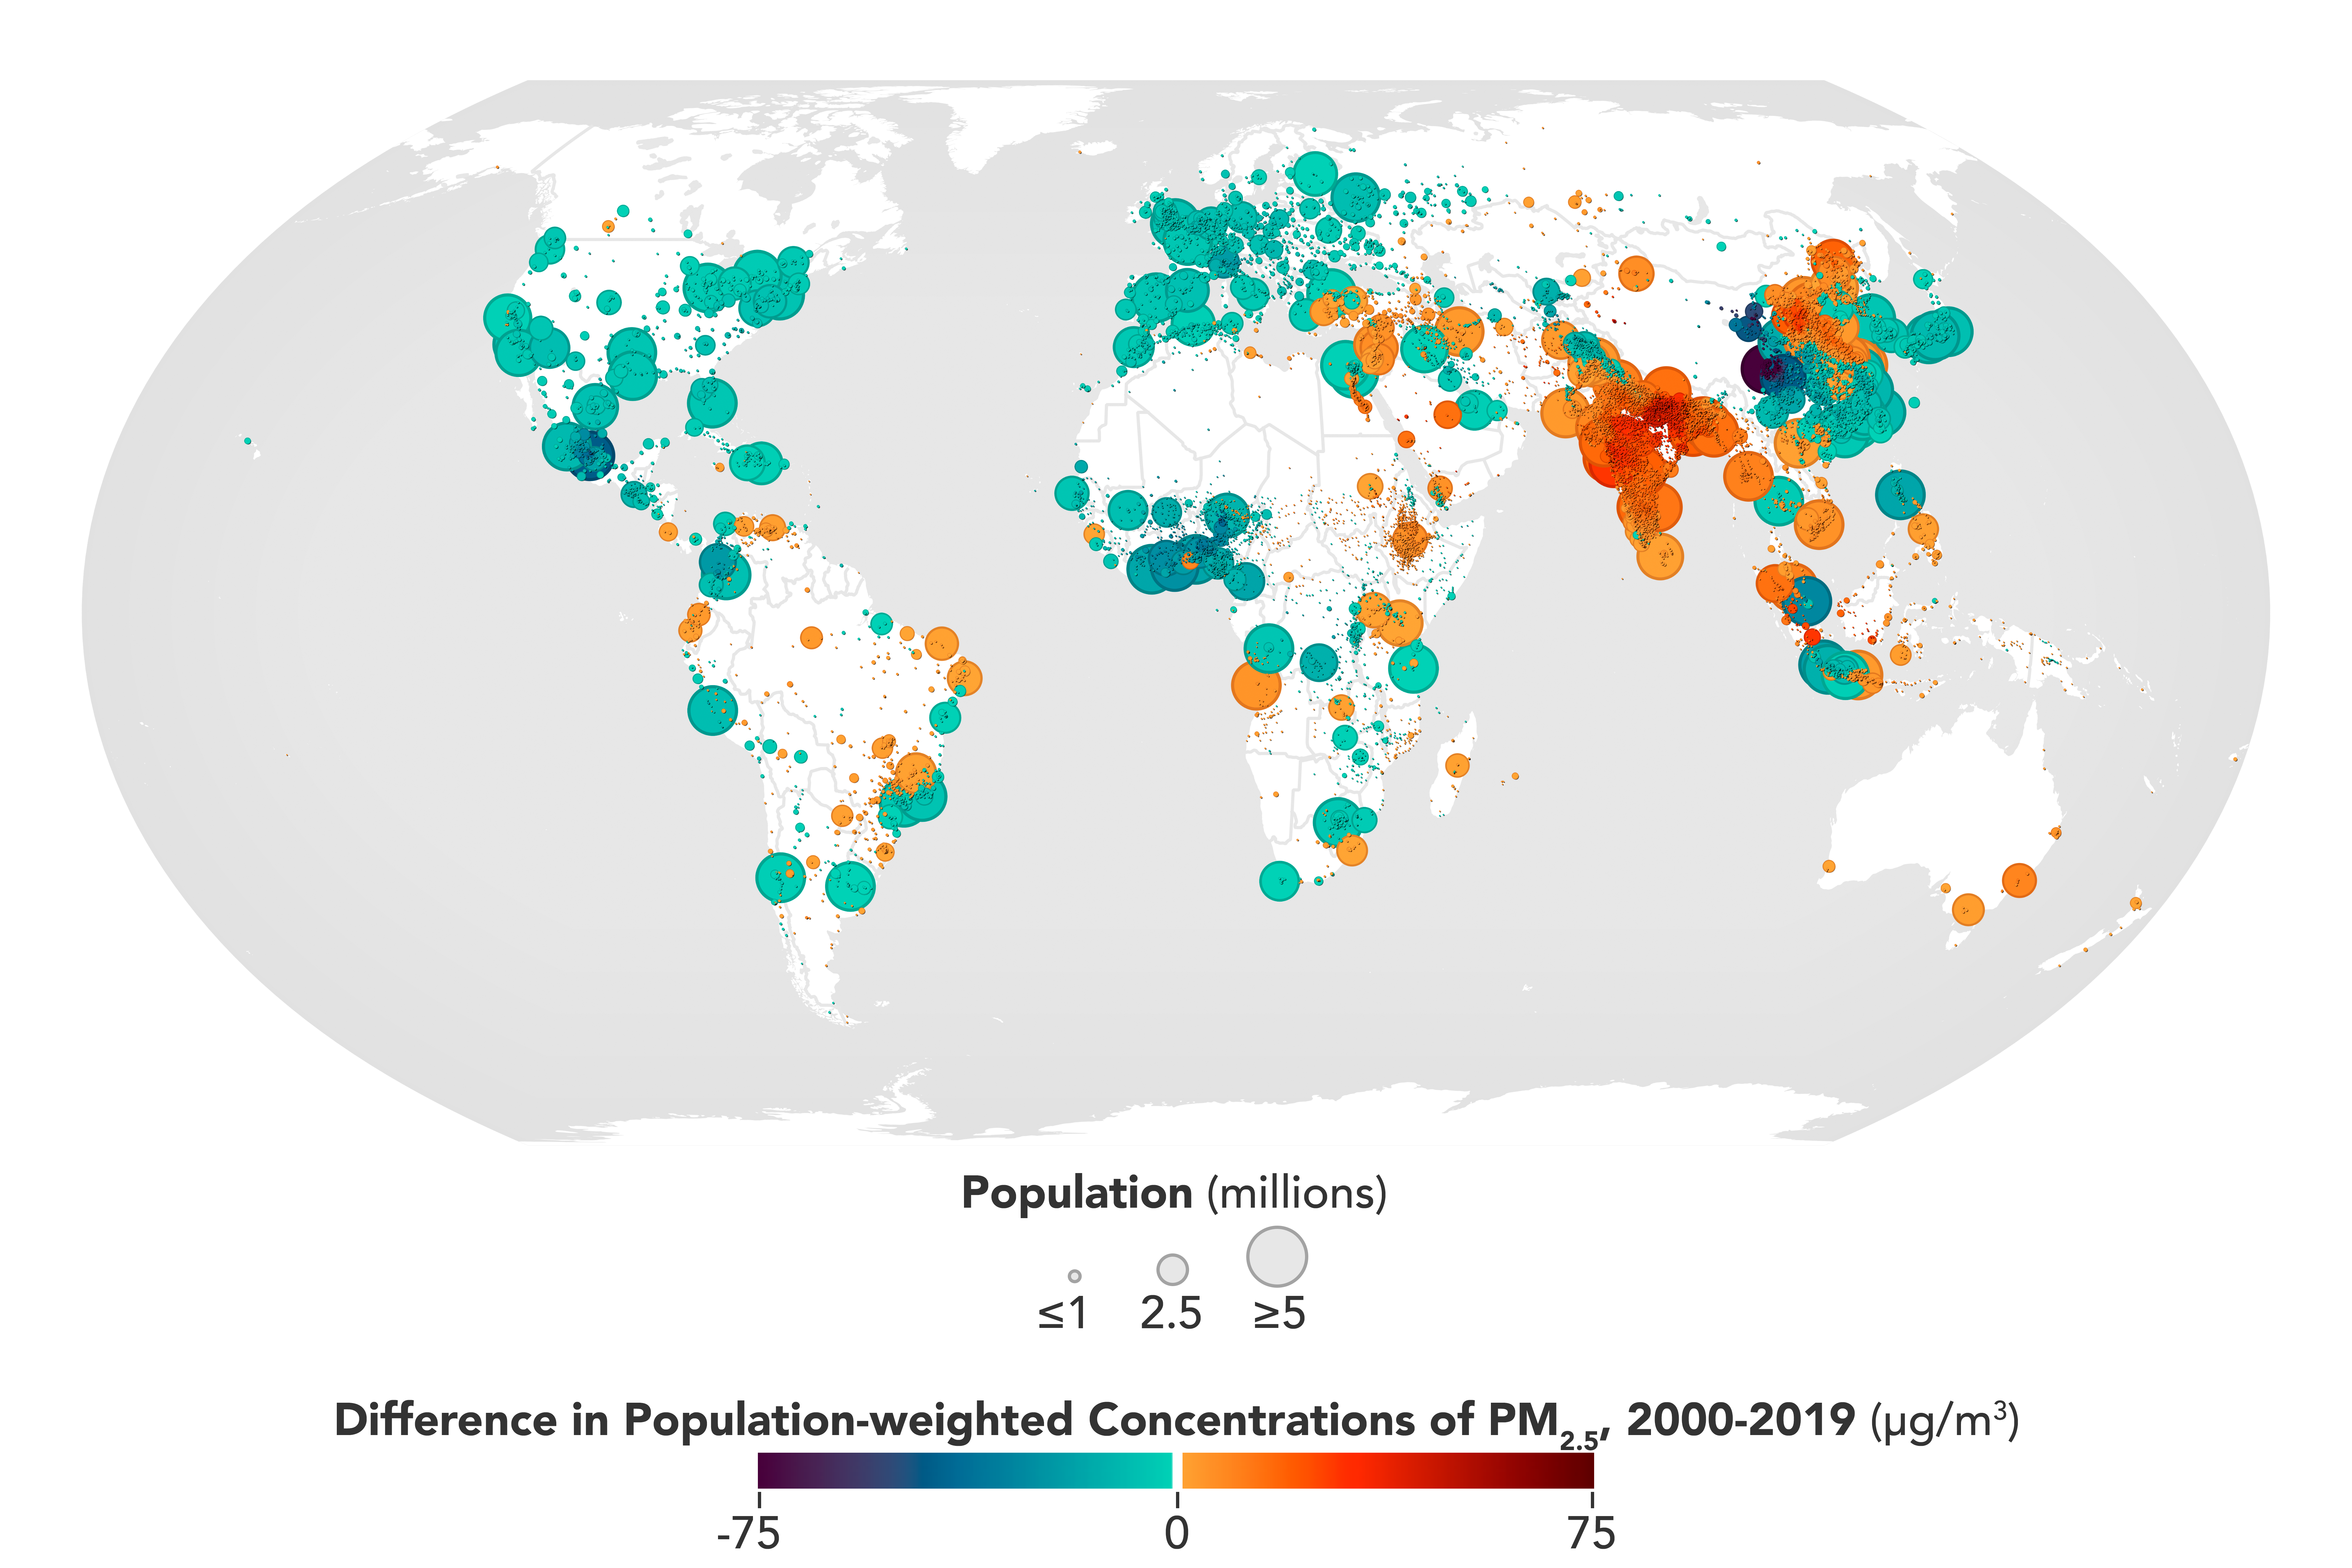
- The teacher posts the image above on a smartboard or projector.
- Direct students to record their responses to the prompt “I see_________. This means___________” on a sticky note.
- Identify students with descriptive observations and accurate interpretations.
- Call on students who they have identified to share out what they wrote on their sticky note.
Student Observe and Interpret Directions:
- Choose one of the two images to focus on at your table.
- On your sticky note, write your name and the letter or number of the image.
- As you observe and interpret the image, you will write one sentence using the prompt,
- “I see__________. This means_________.”
- Extension: On a second sticky note, write a question or draw a picture that relates to the image. Make sure to write your name and letter or number of the image on your sticky note.
- Repeat steps 1-4 for the second image at your table.
Identify 1 student with a descriptive observation and accurate interpretation for each of the images to share their “I see_____ This means___” statement with the whole class.
Note any misconceptions students have in their interpretations.
Gallery Walk/ CER Round 1:
Teacher prep: Write Image 1 on two separate pieces of chart paper. Do the exact same thing for Image 2, Image A, and Image B. Tape the appropriate image in the center of each piece of chart paper.
SAY: “Now, we will look at all of the images and how your peers have interpreted them to help us begin to answer our essential question, “Between 2000 and 2019, how have changes in air quality impacted human health in cities across the globe?”
- 1-2 students from each group will place all sticky notes from their group on the appropriate pieces of chart paper. There are two charts for each image so students should evenly spread out sticky notes between the two charts.
- Students observe the images and sticky note comments on the chart paper around the room.
- On their CER Organizer, students write an initial claim and complete the round 1 section.
Students will continue to revise and add on to their response throughout the lesson. Students will use their CER Organizer to help them write a constructed response to the essential question. As such, students do not need to write full sentences on their organizer. They can write bullet point notes.
Explain:
Teacher Prep:
- Print the NASA Earth Observatory Particulates Article (for half of your students)
- Print NASA Earth Observatory Nitrogen Dioxide Article (for half of your students)
SAY: “The images that you observed and interpreted in the explore section of the lesson are figures in the articles that you and your classmates will read. Now, we will read articles to gather more evidence that will help us better understand how changes in air pollution levels have impacted people living in cities.
Close Read:
- Students who observed images A & B will read, No Breathing Easy for City Dwellers: Particulates.
- Students who observed images 1 & 2 will read, No Breathing Easy for City Dwellers: Nitrogen Dioxide.
- Students annotate as they read:
- Underline confusing words and phrases.
- Circle important words/phrases.
- Use a question mark (?) for questions that you have during the reading. Be sure to write your question in the margin.
- Use an exclamation mark (!) for things that surprise you, and briefly write in the margin what it was that caught your attention.
- Students complete Round 2 of their CER organizer. Next to Claim 2 at the top, students have the space to write a revised claim.
Evaluate:
Students will use their CER organizer to write a constructed response to the essential question.
Peer Assessment:
- In pairs, students will use the rubric below to self-assess a partner. Students will also provide one another with a “grow” - something to work on - and a “glow” - a strength in their response. Feedback should be kind, specific and helpful.
- Students will make revisions to their constructed response using peer feedback.
- Teachers will use the CER rubric below to evaluate students’ work.
Answer Key:
Teachers who are interested in receiving the answer key, please complete the Teacher Key Request and Verification Form. We verify that requestors are teachers prior to sending access to the answer keys as we’ve had many students try to pass as teachers to gain access.
Sources:
- City and Town Population Totals: 2020-2021. (2022, May 16). Census Bureau. Retrieved August 12, 2022, from https://www.census.gov/data/tables/time-series/demo/popest/2020s-total-…
- ClimateBits: Unhealthy Air. (2019, August 8). YouTube. Retrieved August 12, 2022, from https://www.youtube.com/watch?v=bD1DzARqFYE
- Consumer, industrial products now a major urban air pollution source. (2018, February 15). NOAA Research. Retrieved August 6, 2022, from https://research.noaa.gov/article/ArtMID/587/ArticleID/2335/Consumer-in…
- File:US Sanctuary Cities Map.svg. (n.d.). Wikimedia Commons. Retrieved August 12, 2022, from https://commons.wikimedia.org/wiki/File:US_Sanctuary_Cities_Map.svg
- Health Impacts. (n.d.). NASA Air Quality. Retrieved August 6, 2022, from https://airquality.gsfc.nasa.gov/health
- 9 out of 10 people worldwide breathe polluted air, but more countries are taking action. (2018, May 2). WHO | World Health Organization. Retrieved August 12, 2022, from https://www.who.int/news-room/detail/02-05-2018-9-out-of-10-people-worl…
- Nitrogen Dioxide | Air Quality. (n.d.). NASA Air Quality. Retrieved August 6, 2022, from https://airquality.gsfc.nasa.gov/no2
- Particulate Matter | Air Quality. (n.d.). NASA Air Quality. Retrieved August 6, 2022, from https://airquality.gsfc.nasa.gov/particulate-matter
- Pratt, S. E. (2022, March 13). No Breathing Easy for City Dwellers: Nitrogen Dioxide. NASA Earth Observatory. Retrieved August 12, 2022, from https://earthobservatory.nasa.gov/images/149560/no-breathing-easy-for-c…
- Pratt, S. E. (2022, March 14). No Breathing Easy for City Dwellers: Particulates. NASA Earth Observatory. Retrieved August 12, 2022, from https://earthobservatory.nasa.gov/images/149580/no-breathing-easy-for-c…
Disciplinary Core Ideas:
- ESS3C: Human Impacts on Earth Systems
- ESS3D: Global Climate Change
Crosscutting Concepts:
- Cause and Effect
- Scale, Proportion, and Quantity
Science and Engineering Practices:
- Analyzing and Interpreting Data
- Using Mathematics and Computational Thinking
- Engaging in Argument from Evidence
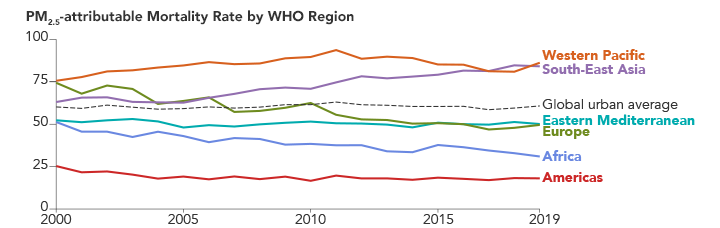
Learners can analyze texts and figures to determine how changes in global air quality impacted human health in cities between 2000 and 2019.
Between 2000 and 2019, how have changes in air quality impacted human health in cities across the globe?
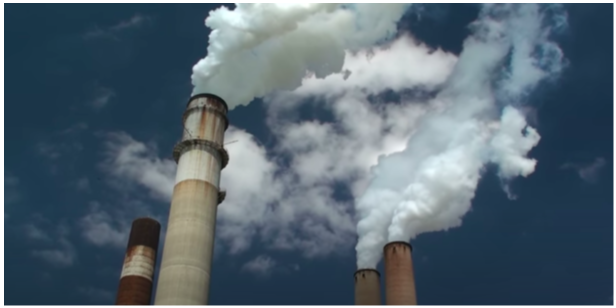
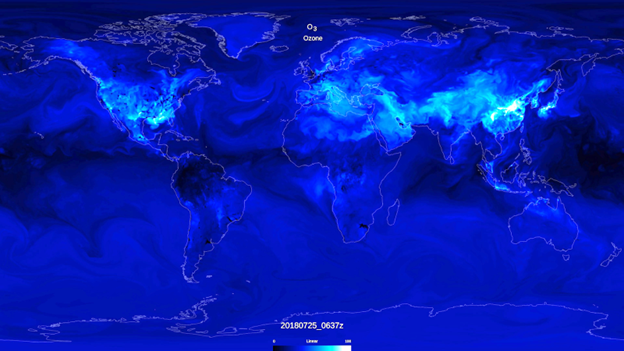
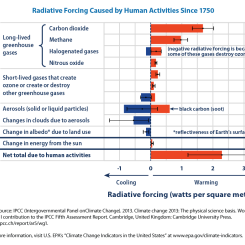
Nitrogen dioxide (NO2), which is unhealthy to breathe (e.g., Anenberg et al., 2018; Eum et al., 2019), is a member of the NOx family (NOx = NO + NO2) and is a necessary ingredient for the formation of unhealthy levels of surface ozone (O3), another important pollutant. It is primarily generated during fossil fuel combustion, so thermal power plants and automobiles are the dominant sources.
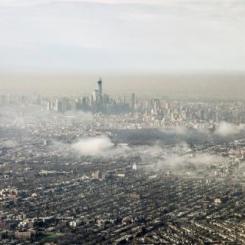
It is estimated that exposure to outdoor air pollution is responsible for about 4 million premature deaths annually with about another 3-4 million resulting from exposure to indoor air pollution; that is, air pollution is responsible for about 1 in 9 deaths worldwide (WHO, 2018; Cohen et al., 2017). The majority of deaths are associated with fine particulate matter of less than 2.5 µm in width (PM2.5). Knowledge of both PM2.5 concentrations and the concentrations of a number of pollutants is required to devise effective mitigation strategies for PM2.5 since it is directly emitted to the atmosphere, such as in the form of smoke and dust, but can also form in the atmosphere through chemical reactions that transform gaseous pollutants (e.g., sulfur dioxide (SO2), ammonia (NH3), nitrogen dioxide (NO2)) to particles (i.e., gas to particle conversion).
Air Pollution Effects on Health
Poor air quality has negative implications for human health.
- Exposure to fine particulate matter of less than 2.5 µm in width (PM2.5) is linked to heart attacks and irregular heartbeats, asthma, decreased lung function, and increased irritability of airways which can lead to coughing and difficulty breathing (EPA). [Video on PM2.5 and its health effects.]
- Exposure to surface-level ozone (O3) has similar impacts on public health as PM2.5, causing shortness of breath, coughing, airway inflammation, aggravation of existing lung diseases, such as asthma and chronic bronchitis, and chronic obstructive pulmonary disease (EPA).
- Exposure to nitrogen dioxide (NO2) also can irritate respiratory pathways, aggravating, for instance, asthma symptoms (EPA).
Exposure to outdoor air pollution is responsible for an estimated 4 million premature deaths annually with about another 3-4 million resulting from exposure to indoor air pollution; that is, air pollution is responsible for about 1 in 9 deaths worldwide (WHO, 2018; Cohen et al., 2017). The majority of deaths are associated with PM2.5. Exposure to O3 is associated with about another 250 thousand deaths annually worldwide (Cohen et al., 2017). In the U.S., outdoor PM2.5 remains the fifth highest mortality risk factor; just in 2015, it was estimated to cause about 88,400 deaths (Cohen et al., 2017). Outdoor O3 was estimated to cause an additional 11,700 deaths (Cohen et al., 2017). For additional information, visit the State of Global Air/2018, which is produced by the Health Effects Institute and the Institute for Health Metrics and Evaluation.
Sources:
- Nitrogen Dioxide | Air Quality. (n.d.). NASA Air Quality. Retrieved August 6, 2022, from https://airquality.gsfc.nasa.gov/no2
- Particulate Matter | Air Quality. (n.d.). NASA Air Quality. Retrieved August 6, 2022, from https://airquality.gsfc.nasa.gov/particulate-matter
- Health Impacts. (n.d.). NASA Air Quality. Retrieved August 6, 2022, from https://airquality.gsfc.nasa.gov/health
Knowledge of types and sources of air pollution.
Air quality has gotten worse over time.
This lesson relates to Social Studies themes including geography, population growth, and urban development and planning. It also relates to the common core math standard related to creating scales with defined quantities to display in a model or data visualization.
Elaborate:
Teacher Prep: Post slides on Google Classroom (can view)
Students who are ready for an extension will explore Dr. Susan Anenberg’s slides and complete round 3 of their CER Organizer.
Source:
Kunerth, M. (2020, December 10). Health and Air Quality Applications Program Review 2020. NASA Applied Sciences. Retrieved August 21, 2022, from https://appliedsciences.nasa.gov/join-mission/publications-resources/he…
- Teacher computer/projector only
- Color Printer


