Lesson Plans
Changes in Criteria Pollutant Levels in the U.S.
Overview
In this 5E lesson plan, students will synthesize information from maps and texts to determine how levels of criteria pollutants changed between 2005 and 2021. Through cooperative learning strategies, students will begin by researching one criteria pollutant then will share their data analysis and research with their peers so that all students acquire the background knowledge about sulfur dioxide, ground-level ozone, nitrogen dioxide, and carbon monoxide. As a summative assessment, students will construct CERs for the three essential questions of the lesson. The CERs that students complete will be the pre-work that they need before participating in a Socratic seminar in which students will discuss the essential questions.
Materials Required
- computers
Procedure
Teacher Setup:
- Post Criteria Pollutant Slides on google classroom (can view)
- Print Criteria Pollutant Graphic Organizer (1 per student)
- Print CER Graphic Organizer (1 per student)
Engage:
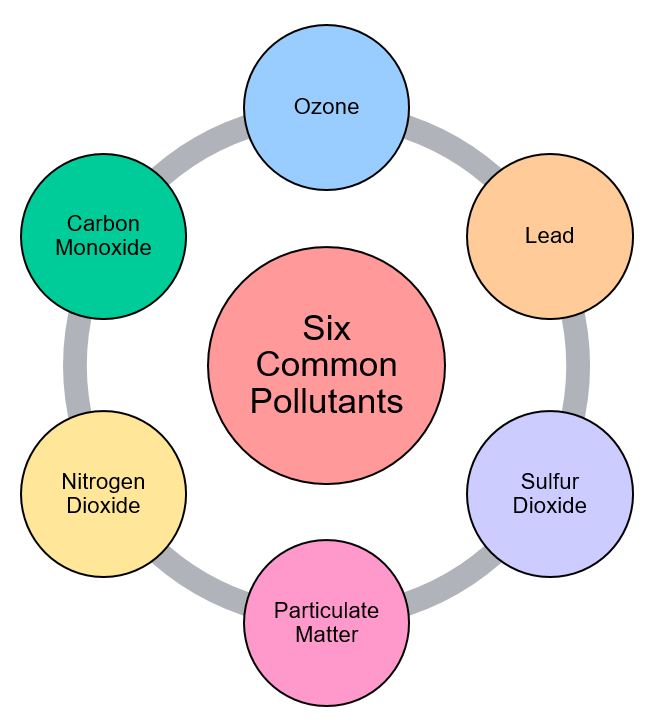
Teacher framing: “An instrument on NASA’s AURA Satellite measures nitrogen dioxide levels across the globe. nitrogen dioxide is one of the EPA’s six “criteria air pollutants.” They are called criteria pollutants because the EPA has created health and environmental criteria that they use to regulate the levels of these pollutants in the air that we breathe.”
As students watch, NASA | Human Fingerprint on Global Air Quality, they answer the following question:
- What are some of the human activities that have reduced nitrogen dioxide levels? Possible Answers: Environmental regulations, people demanding cleaner air, civil war
- What are some of the human activities that have increased nitrogen dioxide levels? Possible Answers: Coal generation, regions where people take refuge, oil and natural gas extraction
Explore:
Recommended: 1 laptop per table in a place where all students can see the screen.
Teacher assigns groups, and students volunteer for a role.
- Roles:
- Tech Support (opens slides on a laptop)
- Speaker (shares out findings with the whole class)
- Envoy (during explain portion of the lesson, envoy goes to other groups to teach them about their group’s criteria pollutant)
- Scribe (writes down ideas and questions for the group when needed)
Teacher assigns each group one criteria pollutant to research (Sulfur Dioxide, Ground-level Ozone, Nitrogen Dioxide or Carbon Monoxide) and the tech support student in each group opens the slides for their group on a laptop.
Criteria Pollutant Slides:
Students observe slides that show levels of the criteria pollutant during four different seasons in the United States during 2005 and 2021. Students will record four observations of the data.
Teacher will remind students to keep the following essential question in mind as they are making observations:
- From 2005 and 2021, how have levels of criteria pollutants changed in the United States?
- Prompts for student observations:
- In what regions of the United States were there high levels of your criteria pollutant?
- Were levels of your criteria pollutant higher in 2005 or 2021?
- How did levels of the criteria pollutant vary across seasons?
- Was the criteria pollutant spread out over a large area or concentrated in a smaller region?
Ideas Tournament Cooperative Learning Strategy:
- In groups of four, individuals find a partner.
- With their partner, participants share and discuss their observations, and come to a consensus on the two most important observations.
- Participants find a new partner in their group of four.
- With their new partner, participants share and discuss their top two observations, and come to a consensus on the one most important observation.
- Once they have shared, the whole group of four must come to a consensus on the group’s one most important observation.
- The speaker in each group will share the group’s observation with the whole class. Teacher will record these observations on chart paper for students to see.
Exit Ticket: Respond to the following essential question using evidence from our classes’ observations of criteria pollutant data.
- Essential Question: From 2005 and 2021, how have levels of criteria pollutants changed in the United States?
Explain:
Teacher framing: Our first essential question is: From 2005 and 2021, how have levels of criteria pollutants changed in the United States? So far, we have looked at data to help us understand if levels of these pollutants have improved or worsened. Now, we can investigate our second essential question: What factors could be contributing to changes in levels of criteria pollutants? So, we will gather background information on the criteria pollutants and where they come from. To do this, we will engage in an envoy protocol.
Recommended: 1 to 1 device or print out relevant paragraphs from the EPA website.
- Each group researches the criteria pollutant that they were assigned at the beginning of the lesson using the following links from the EPA website:
- As students read, they take notes using the Criteria Pollutant Graphic Organizer.
- The envoy from each group will rotate between other tables to teach the other groups about their criteria pollutant.
- After each envoy has taught all groups about their pollutant, all envoys will meet to teach one another about their pollutants. While the envoys are meeting, the rest of the class will debrief the experience with the teacher.
The speaker in each group will share out factors that could have caused levels of their criteria pollutant to improve or worsen in the past two decades. Examples: EPA standards led to states controlling air pollution through measures such as emissions limits, air quality monitoring, and enforcement of control measures or there was an increase in car emissions which is a source of NO2
Evaluate:
Students will engage in a Socratic seminar to answer the essential questions. In preparation for the Socratic seminar, students will use their Criteria Pollutant Graphic Organizer and the class observations (on chart paper) to prepare CERs that answer the essential question. Students may use this CER Graphic Organizer to prepare for their Socratic seminar.
Note to Teachers: The claim is listed at the bottom of the graphic organizer so that students articulate their evidence and reasoning before drawing a conclusion; however, feel free to change the order depending on what works best with your students.
Socratic Seminar Protocol:
To begin the seminar, the facilitator (teacher or student leader) asks, from 2005 and 2021, how have levels of criteria pollutants changed in the United States? Students respond to this question, referencing evidence from their CER Graphic Organizer and building off of what their peers have stated.
The facilitator may ask follow-up questions or move on to the next essential question: What factors could be contributing to changes in levels of criteria pollutants?
After students have responded to this question, facilitators ask: What additional data or information would you need to gather in order to more thoroughly answer the questions above? How would this data and/or information give you more confidence in your claims?
As students share-out, teachers evaluate students using the rubric below.
Elaborate:
From the satellite images, where might we suspect that there are nonattainment areas in the United States? (Nonattainment areas are regions where air quality does not meet the EPA standards).
Answer Key:
Teachers who are interested in receiving the answer key, please complete the Teacher Key Request and Verification Form. We verify that requestors are teachers prior to sending access to the answer keys as we’ve had many students try to pass as teachers to gain access.
Sources:
- “List of all Atmosphere STEM Career Connections | MyNASAData.” My NASA Data, https://mynasadata.larc.nasa.gov/all-atmosphere-stem-career-connections. Accessed 12 August 2022.
- “NASA | Human Fingerprint on Global Air Quality.” YouTube, 14 December 2015, https://www.youtube.com/watch?v=aMnDoXuTGS4. Accessed 12 August 2022.
- “What Causes Air Pollution?” NASA Climate Kids, 31 May 2022, https://climatekids.nasa.gov/air-pollution/. Accessed 12 August 2022.
Disciplinary Core Ideas:
- ESS3C: Human Impacts on Earth Systems
Crosscutting Concepts:
- Cause and Effect
Science and Engineering Practices:
- Analyzing and Interpreting Data
- Engaging in Argument from Evidence
Learner can synthesize information from maps and texts to determine how levels of criteria pollutants have changed from 2005 to 2021.
- From 2005 and 2021, how have levels of criteria pollutants changed in the United States?
- What factors could be contributing to changes in levels of criteria pollutants?
- What additional data or information would you need to gather in order to more thoroughly answer the questions above? How would this data and/or information give you more confidence in your claims?
This document from the Environmental Protection Agency titled Criteria Air Pollutants has good background information.
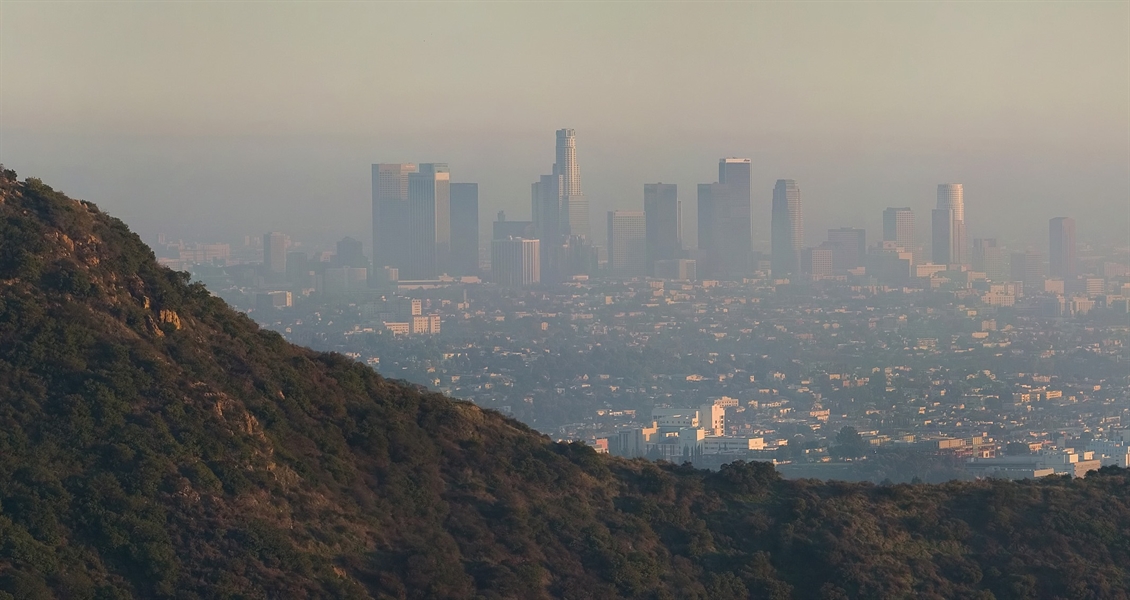
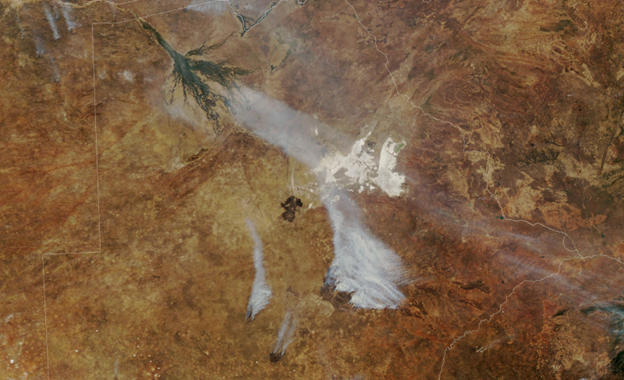
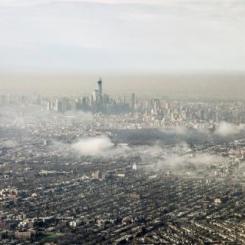
Air pollution is caused by solid and liquid particles and certain gasses that are suspended in the air. These particles and gases can come from car and truck exhaust, factories, dust, pollen, mold spores, volcanoes and wildfires. The solid and liquid particles suspended in our air are called aerosols.
Source:
- “What Causes Air Pollution?” NASA Climate Kids, 31 May 2022, https://climatekids.nasa.gov/air-pollution/. Accessed 12 August 2022.
- Pollution has only gotten worse over time
- There is only one type of air pollution
Connections to the Clean Air Act could be made in government and American History classes.
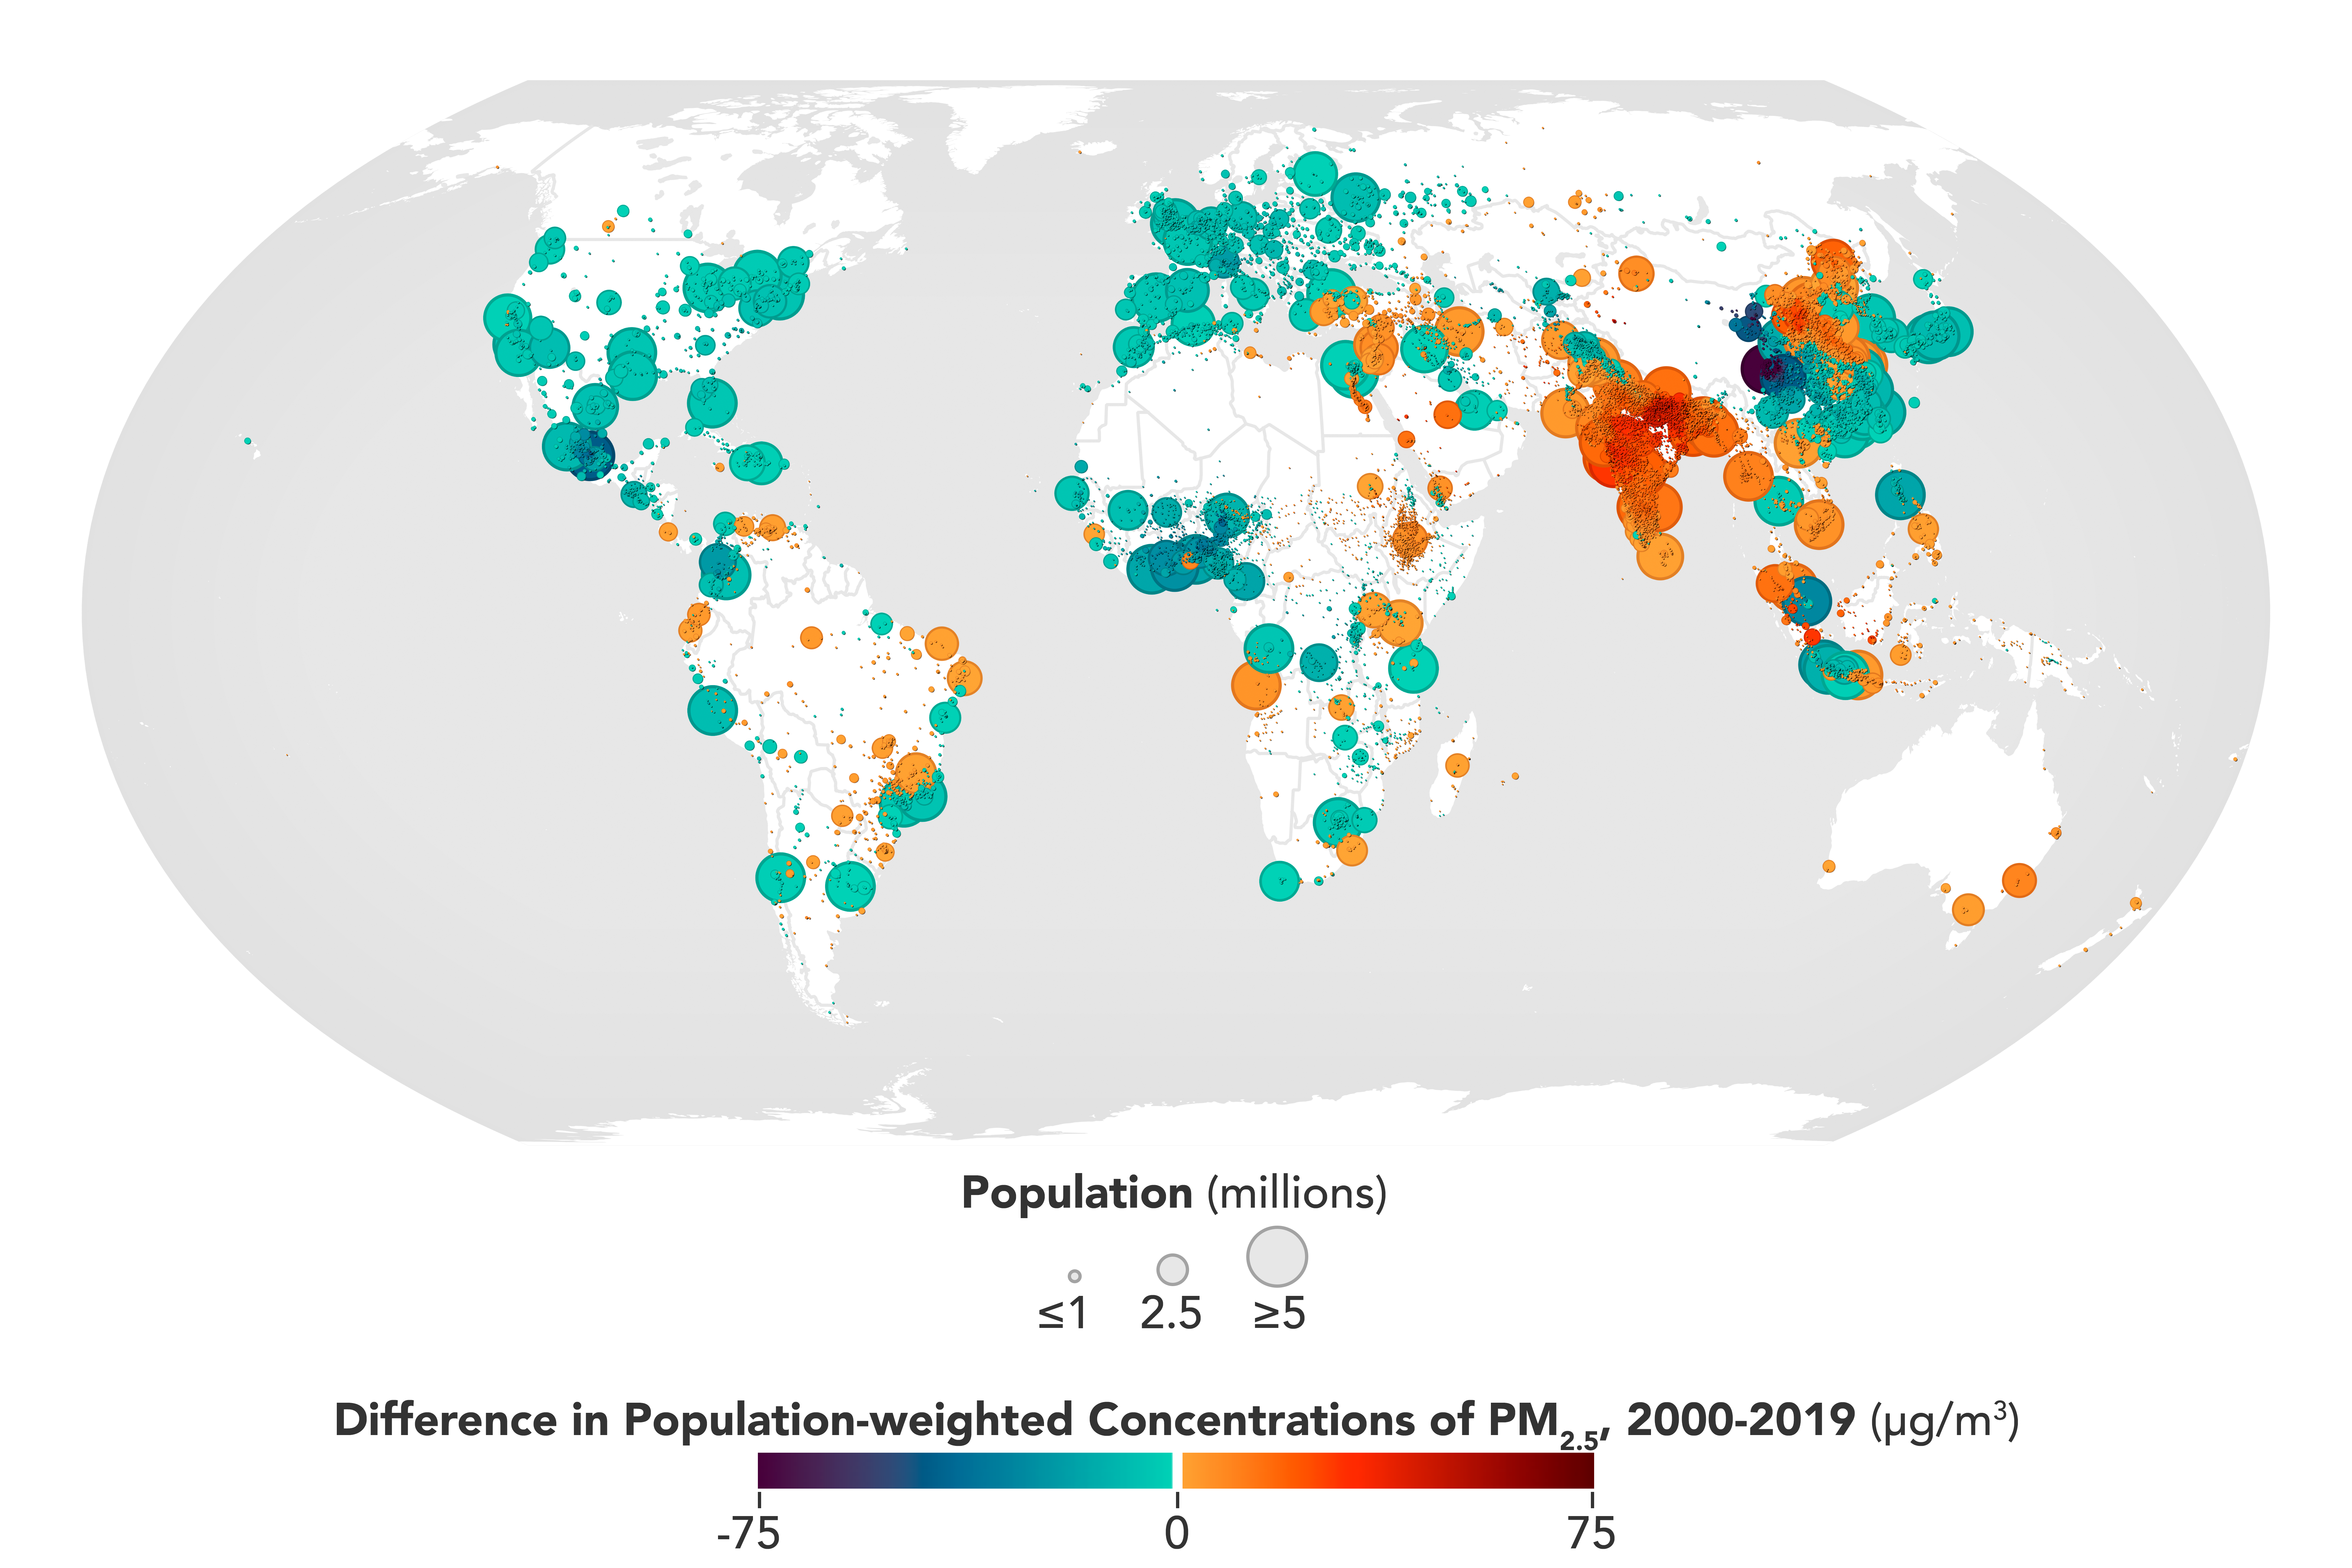
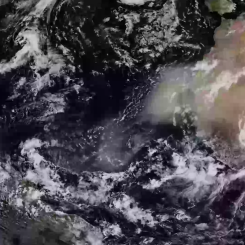
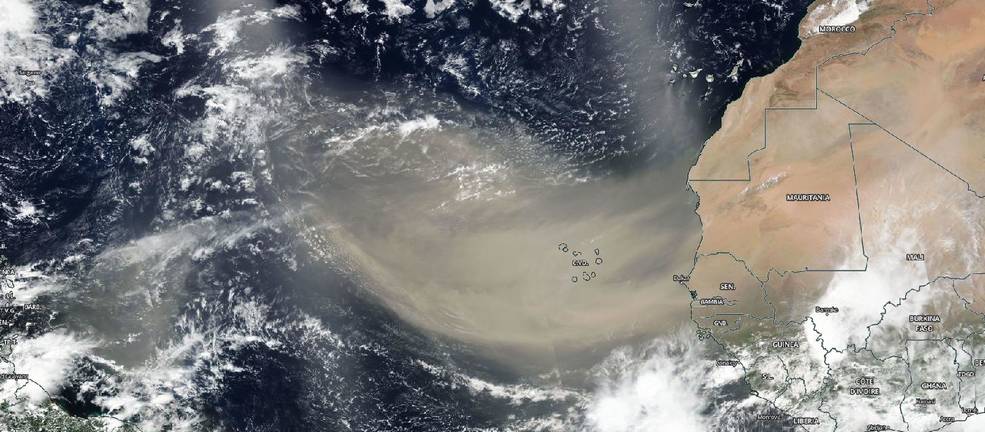
NASA studies criteria pollutants because they are harmful to the environment and human health. These satellite images help scientists understand the movement of these pollutants across the troposphere.
Atmospheric Scientist: Atmospheric scientists study the weather and climate and examine how those conditions affect human activity and the earth in general. Most atmospheric scientists work indoors in weather stations, offices, or laboratories.
GIS Scientists and Technologists: Geospatial Information Scientists and Technologists research geospatial data or develop geospatial technologies.
Mechanical engineers: Mechanical engineers design, develop, build, and test mechanical and thermal sensors and devices including tools, engines, and machines.
Data scientist: Data scientists work with data captured by scientific instruments or generated by a simulator, as well as data that is processed by software and stored in computer systems. They work with scientists to analyze databases and files using data management techniques and statistics.
Remote sensing specialist: Remote sensing scientists use sensors to analyze data and solve regional, national and global concerns. For instance, natural resource management, urban planning, and climate and weather prediction are applications of remote sensing.
Extension question: From the satellite images, where might we suspect that there are nonattainment areas in the United States?
NOTE: Nonattainment areas are regions where air quality does not meet the EPA standards.
- Internet Required
- One-to-One (tablet, laptop, or CPU)
Complementary Lesson Plans

Complementary Mini Lessons
Interactive Files
Grade Band
- 9-12
Time
- > 90 minutes
Visualization Tool
NGSS Three Dimensional Learning
- See drop-down menu at the bottom of the page