Interactive Models
Creating Images from Numbers
Overview
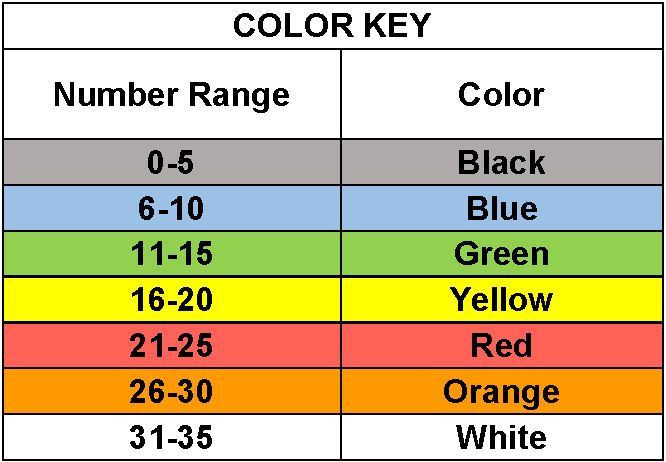
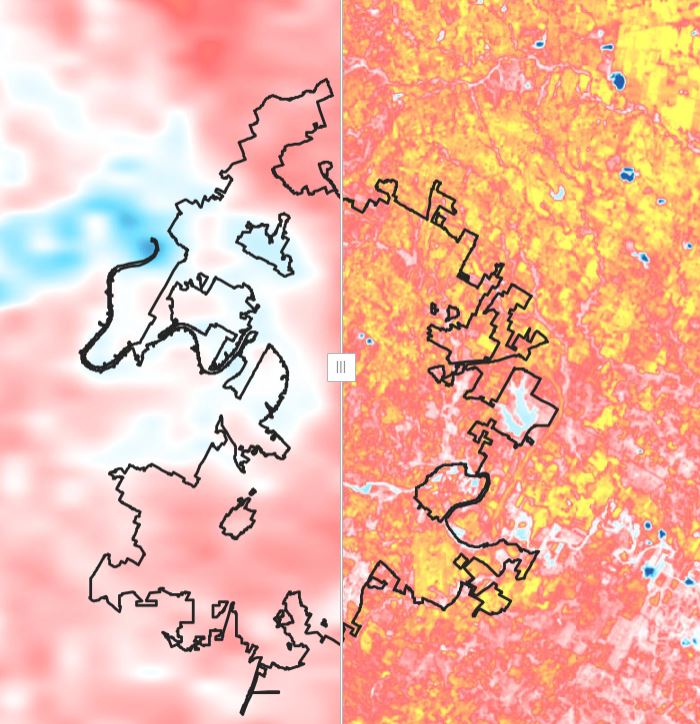
Scientific data are often represented by assigning ranges of numbers to specific colors. The colors are then used to make false color images which allow us to see patterns more easily. Students will make a false-color image using a set of numbers.
Directions
Materials
- Colored pencils or crayons: White, Orange, Red, Yellow, Green, Blue, Black or self selected colors
- Handouts
Steps
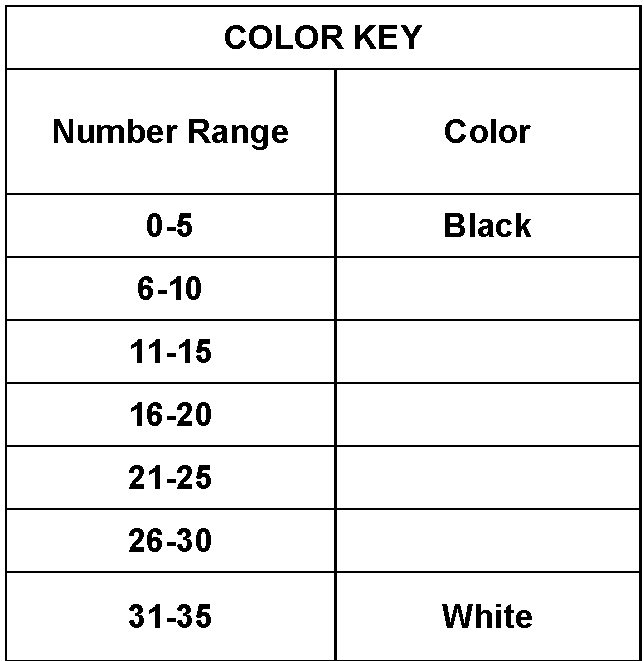
- Use the COLOR KEY provided or complete the blank table to create your own COLOR KEY.
- If you create your own, select each color to represent numbers in the ranges with no color identified.
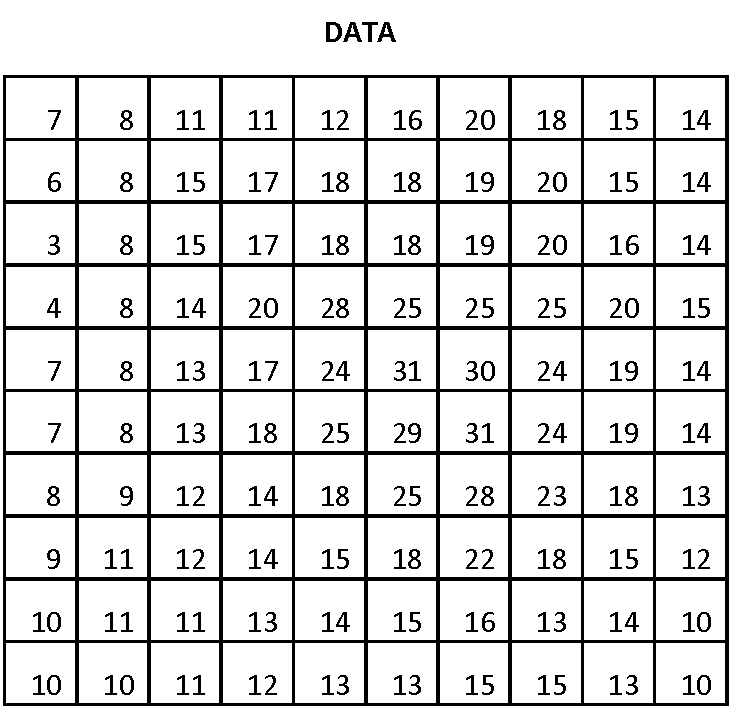
- Use the DATA table provided to color the cells on your GRID with the colors in your COLOR KEY. (You may use the interactive slides to drag and drop the colors.)
- Check with your instructor on how to submit answers.
Summarize
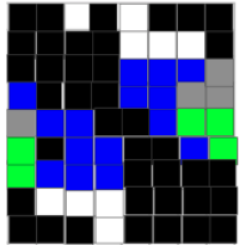
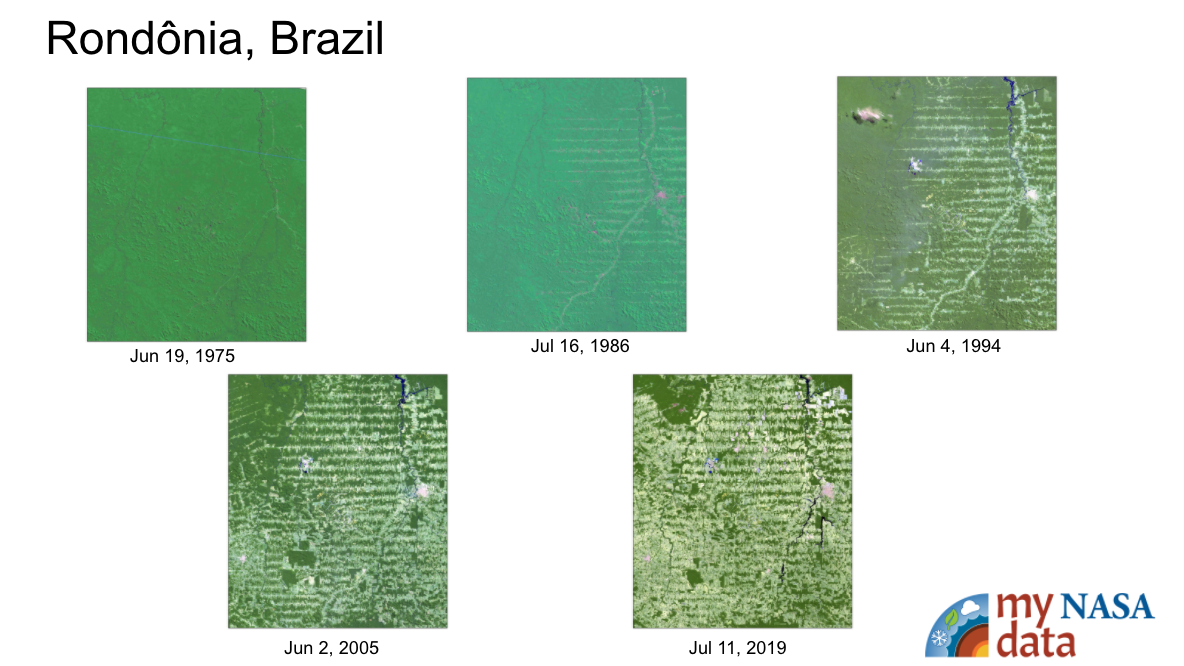
The image you created is called a false-color image because the image is made from colors assigned to numbers and not a photograph. The numbers are data that could come from many different sources. The concept of creating an image from data is the same regardless of where the data come from. The data could be wind speed, elevation or other variables.
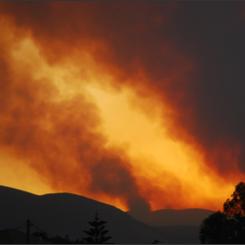
You can see false color images in the video NASA Sees 30 Years of Yellowstone Recovery from 1988 Fires. The burn scars are not red in visible images.
Questions
Answer the questions below.
- Answer the following questions if the data are wind speed in km per hour.
- What color is the fastest? Slowest?
- Where is the wind between 21-25 km per hour?
- Answer the following questions if the data are elevation in meters above sea level.
- What color is the lowest? Highest?
- Where is the elevation between 31 and 35 meters above sea level?
- Do you notice any pattern in the image?
- How does the size of the grids in the grid paper affect the image that you created?
- Which do you think would be more realistic, larger grid sizes or smaller? Why?
Sources:
- Dunbar, Brian. “Remote Sensing Math Educator Guide.” NASA, NASA, Retrieved on May 30, 2013, from https://www.nasa.gov/stem-ed-resources/remote-sensing-math.html.
- Video: NASA's Scientific Visualization Studio
Images courtesy of Jim Peaco, National Park Service and the United States Geological Survey and NASA's Earth Observatory
Teacher Note
Teachers who are interested in receiving the answer key, please complete the Teacher Key Request and Verification Form. We verify that requestors are teachers prior to sending access to the answer keys as we’ve had many students try to pass as teachers to gain access.
- One-to-One (tablet, laptop, or CPU)
- One-to-a-Group
- Teacher computer/projector only
Complementary Interactives
Complementary Mini Lessons
Complementary Lesson Plans
Document Resources
Interactive Files
Grade Band
- 6-8
Time
- 15 minutes