Lesson Plans
Cloudy vs. Clear - Maps
Overview
Students will analyze and interpret maps of the average net atmospheric radiation to compare the flow of energy from the Sun toward Earth in different months and for cloudy versus clear days. Students will draw conclusions and support them with evidence.
Materials Required
- Student sheets (Google Doc or Google Form)
Procedure
Part 1: Practice interpreting map images
- Group students.
- Distribute Clear Day map image from July to groups (image in Google Slides).
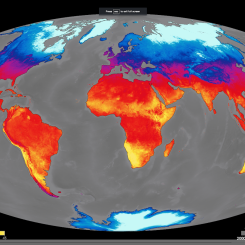
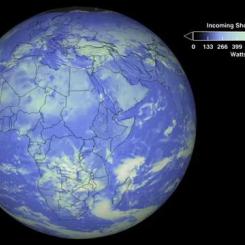
- Explain to students the background of the data visualized on the map. The map visualizes the Monthly Net Flow of Energy towards Earth by Longwave and Shortwave Radiation without clouds in July 2019. This quantity describes the total net flow of energy from Earth to space. The quantity determines if a location on Earth is cooled or warmed by total shortwave and longwave radiation. Cooling is represented by negative values, and warming is represented by positive values.
- Direct students to analyze the image. (Students may find the Map Question Cube helpful in understanding and analyzing map images.)
Part 2: Compare images from different months
- Review the months for the seasons in the Northern Hemisphere if necessary.
- Distribute Clear Day map image from January to groups (image in Google slides).
- Have groups compare the clear day images in January and July, then answer the questions.
- What do you observe about the average net radiation on the July map?
- What do you observe about the average net radiation on the January map?
- What differences do you see between the two maps?
- What do you think the reason is for the differences you see?
Part 3: Compare images for cloudy versus clear days
- Collect the Clear Day map images for January and have students keep the Clear Day map images for July.
- Hand out the Cloudy Day map image for July (image in Google slides).
- Have groups compare the images and answer the questions.
- What do you observe about the average net radiation on the Cloudy Day map?
- Identify any areas in the Northern Hemisphere where there is cooling with and without clouds.
- What do you think could cause cooling during this season?
- What differences do you see between the two maps?
- What do you think is the reason for the differences?
- Where do you think the most clouds were during the month of July?
Making Sense of the Data
- Why do we care about the flow of energy from the Sun toward Earth in different months?
- Why should we care about the presence of clouds versus clear days?
Exit Ticket
- Will clouds be the solution to global climate change? Explain your answer.
Disciplinary Core Ideas:
- ESS2D: Weather and Climate
Crosscutting Concepts:
- Cause and Effect
- Scale, Proportion, and Quantity
Science and Engineering Practices:
- Developing and Using Models
- Analyzing and Interpreting Data
- Engaging in Argument from Evidence
- Students will analyze and interpret maps showing energy from the Sun in different months
- Students will analyze and interpret maps showing energy from the Sun on clear and cloudy days
- Students will draw conclusions about differences in the amount of energy from the Sun that reaches land, water, and air on cloudy versus clear days
- How do clouds affect the amount of energy Earth receives?
- What are the differences in the amount of energy received in the Northern Hemisphere in different seasons?
- What are the differences in the amount of energy received in Earth's Southern and Northern hemispheres in the same month?
Net Radiation
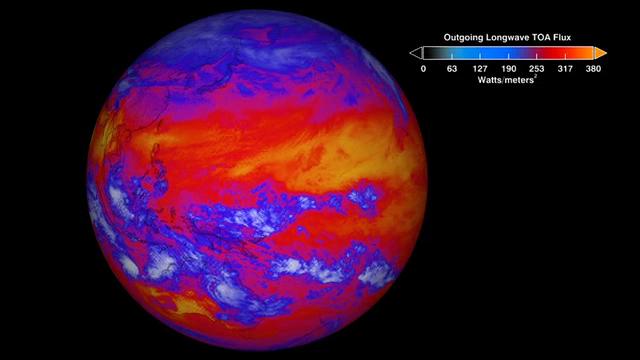
The Sun's radiant energy is the fuel that drives Earth's climate engine. The Earth-atmosphere system constantly adjusts to maintain a balance between the energy that reaches Earth from the Sun and the energy that flows from Earth back out to space. Energy received from the Sun is mostly in the visible (or shortwave) part of the electromagnetic spectrum, where Earth's atmosphere is transparent. The solar radiation absorbed by Earth causes the planet to heat up until it is radiating (or emitting) as much energy back into space as it absorbs from the Sun. Earth's thermal emitted radiation is mostly in the infrared (or longwave) part of the spectrum, where Earth's atmosphere is not transparent. Thus, much of the emission to space is from the higher levels of the atmosphere.
The balance between incoming and outgoing energy is called Earth's radiation budget. The difference between the incoming and outgoing energy is called net radiation. A positive value of net radiation means that there is more incoming energy than outgoing energy, which results in the surface and atmosphere warming. The opposite is true when the net radiation is negative.
Net Radiation, Albedo, and the Urban Heat Island
Not all incoming solar radiation is absorbed. About 30% of the solar energy that comes to Earth is reflected back to space by clouds and aerosols or bright surfaces. The ratio of reflected-to-incoming energy is called "albedo" from the Latin word meaning whiteness. Different surfaces reflect the Sun's energy at different rates and thus have different albedos.
Changing surfaces can lead to changing albedo values and changes to the net radiation. For example, the melting of ice replaces a white surface with a darker surface, decreasing the albedo of the surface. This change allows for more energy to be absorbed at the surface and makes the net radiation more positive. When urbanization causes changes to Earth's surface which change the net radiation and increase temperatures in a local area, this is called an Urban Heat Island effect.
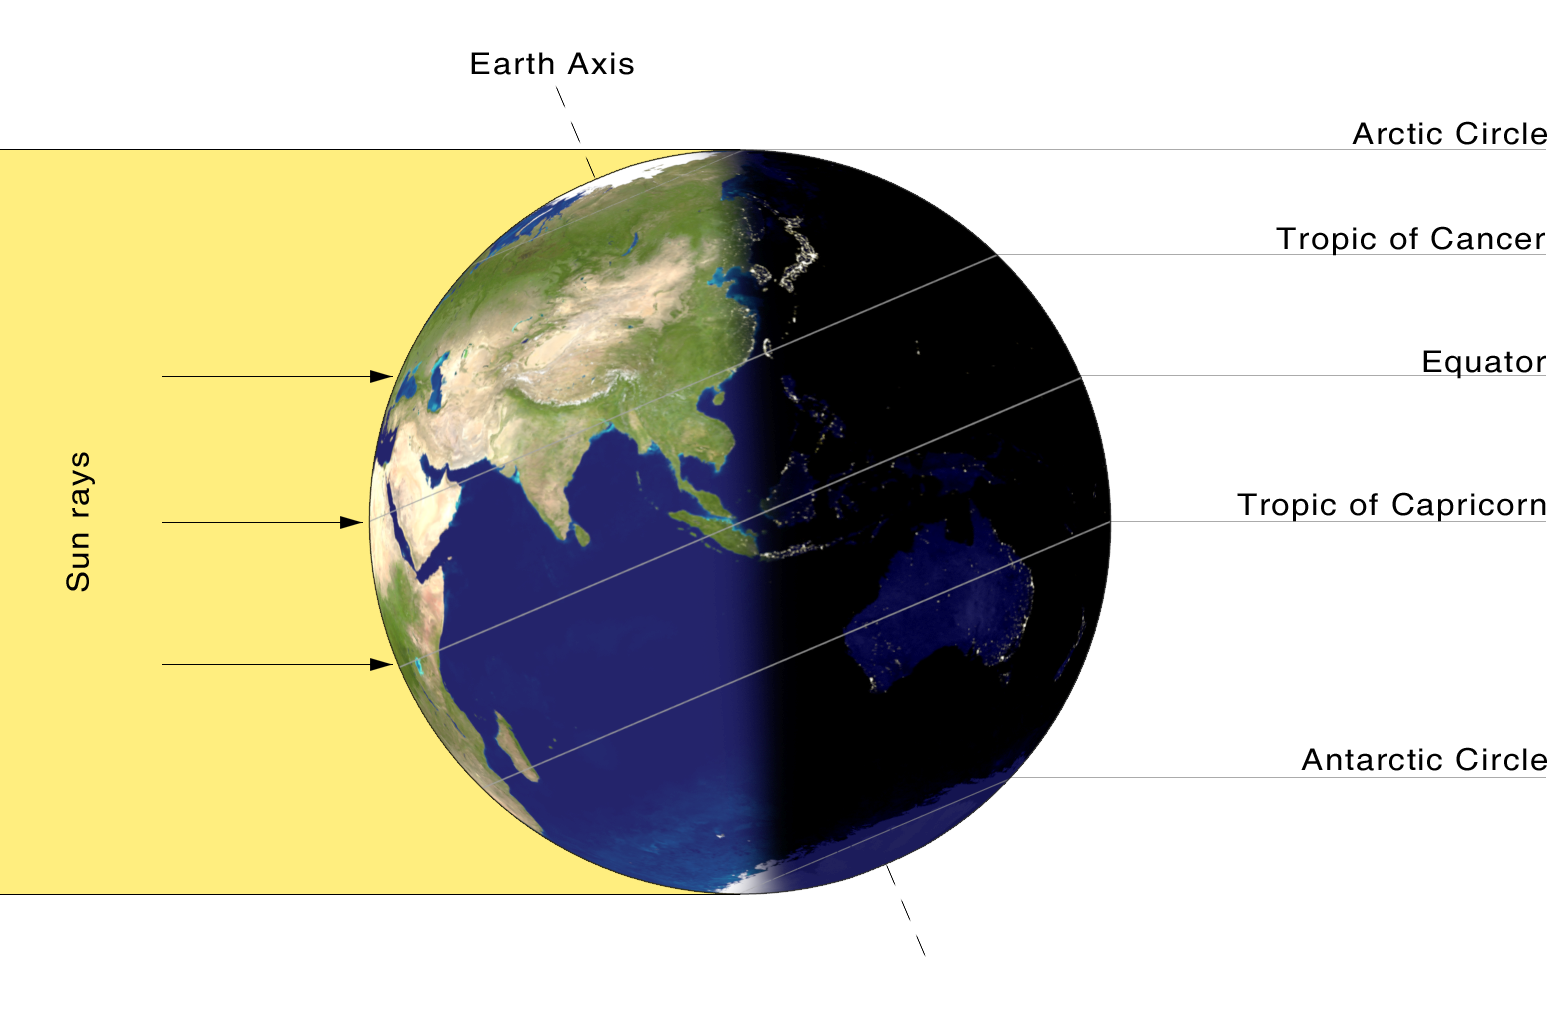
Net Radiation and the Seasons
The seasons are caused as Earth, tilted on its axis, travels in its orbit around the Sun each year. The hemisphere that is tilted toward the Sun absorbs more energy from incoming sunlight (summer) that the hemisphere tilted away from the Sun (winter). During this lesson, students will view NASA data displaying the net radiation in one calendar year during clear and cloudy sky conditions. See NASA Space Place for more information on seasons.
- Knowledge that the Sun's energy heats land, water and air of Earth
- Knowledge of cardinal directions on a map
- Seasons in the Northern Hemisphere
- Introduction to the cause of Earth's seasons
- Understanding of the idea of "net" values is the balance between what is coming into the system and what is leaving it.
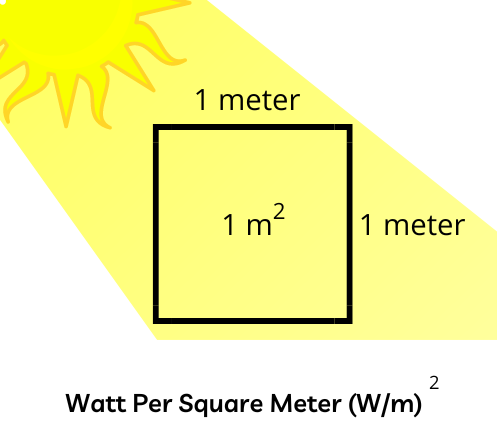
- Understanding of the unites of Watts/m^2
- Skills in deductive reasoning and spatial reasoning using maps
Scientists monitor the Earth System to better understand and meet the challenges of environmental change. For example, knowing how much of the Sun's energy reaches the surface of Earth helps scientists understand dynamics in the spheres within the Earth System, i.e., Atmosphere, Hydrosphere, Cryosphere, and Biosphere. An important variable in understanding these changes is Net Radiation because it impacts temperatures. The warm air rising off Earth's landscapes influences the world's weather and climate patterns. NASA leads a wide range of efforts, including CERES, to collect and interpret these data acquired from satellites, aircraft, and ground networks, and to these data are integrated into numerical models of Earth’s climate at global and regional scales.
Credit: NASA EClips, For more information on CERES see http://ceres.larc.nasa.gov.
Compare data from China to local data obtained from the Earth System Data Explorer. The date can be found under Atmosphere > All Data > Net Atmospheric Radiation. There are two datasets, one with clouds and one without. Tutorials are available here.
- Standalone Lesson (no technology required)
- Internet Required
- One-to-One (tablet, laptop, or CPU)
- One-to-a-Group
Complementary Lesson Plans
Complementary Mini Lessons

Interactive Files
Grade Band
- 6-8
- 9-12
Time
- 50 minutes
Visualization Tool
NGSS Three Dimensional Learning
- See drop-down menu at the bottom of the page