Lesson Plans
Earth’s Energy Budget-Seasonal Cycles
Overview
Students move through a series of short activities to explore and evaluate global solar radiation data from NASA satellites. In this process, students make qualitative and quantitative observations about seasonal variations in net energy input to the Earth System.
Materials Required
Per Student:
- Student Sheet
- Google Slide
Procedure
Part 1:
-
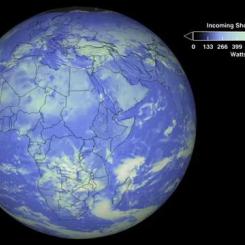
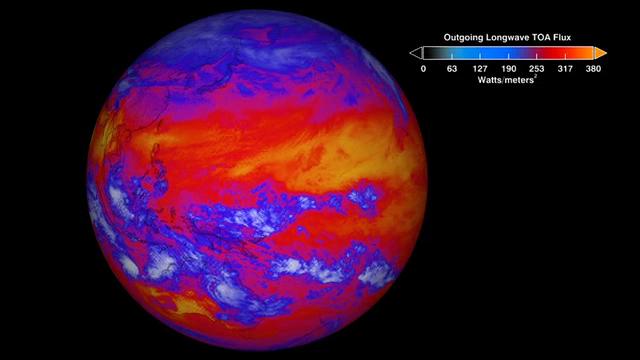
Display the first Student Page (Monthly Net Flow of Energy towards Earth by Longwave and Shortwave Radiation with Clouds). This quantity describes the total net flow of energy from Earth to space. The quantity determines if a location on Earth is cooled or warmed by total shortwave and longwave radiation. Cooling is represented by negative values, and warming is represented by positive values. The complex effects of clouds of this flow of energy are also included in this dataset.
Credit: NASA/My NASA Data -
Distribute the Student Sheet. Do not share the date of the image with students; the date is provided on the Teacher Page. Review the mapped image of Monthly Net Flow of Energy towards Earth by Longwave and Shortwave Radiation with Clouds for an unknown month. Direct students to brainstorm, document, and share three qualitative and three quantitative observations. (NOTE: It is hard to differentiate in the grayscale (black and white) image; you may wish to project the colored image for entire class to view if a color printer is unavailable).
-
Direct students to observe the color legend above the mapped image and its values. It is important to note that the ranges vary among all plots, meaning that the minimum and maximum values may be different and represented by different colors on the color bar. However, negative values are represented by blue in all plots, and positive values are represented by red in all plots.
- What do the false colors represent? (The term "false color" is used to describe the association of colors to specific data values in order to assist in data analysis and interpretation.)
- What are the units of measurement?
- What time of year do you think this image represents? Why?

Part 2:
-
Again, review the Monthly Net Flow of Energy towards Earth by Longwave and Shortwave Radiation with Clouds but tell students that this is an image captured by NASA satellites showing Atmospheric Radiation in January 2015.
- Knowing this date, how does this support or reject your ideas from earlier?
-
Explain that places in white represent areas where the amount of incoming and outgoing energy are in balance. (NOTE: It is hard to differentiate in the grayscale image (black and white image); you may wish to project the colored image for the whole class to view if a color printer is unavailable). Have students analyze the mapped images and identify the following:
- Locations where more energy comes into the Earth System than goes out (positive net radiation) are red/dark gray.
- Places where more energy goes out then comes in (negative net radiation) are blue/white.
-
Allow students to work in teams or independently to answer the following questions:
- What systems are absorbing energy?
- Where do you think more heat is being given off? What evidence do you have to support this?
- Where do you think there is more heat absorbed? What evidence do you have to support this claim?
-
Now, distribute and compare with the image from March 2015.
- What colors do you observe?
- What do you observe at the equator?
- What do you observe at the poles?
- In what area is the most energy being absorbed?
- Where is more energy being released than absorbed?
Part 3:
-
Post the following questions for students to consider as they watch an animation:
- How does net radiation vary over the year at key months in the solar cycle?
- What are the key months where you see the most change?
-
Show Animation of Earth Net Radiative Flux video and then review students’ answers. NOTE: This video shows the difference between how much solar energy enters the Earth system and how much heat energy escapes into space, also known as net radiation from July 2006 to the present. Some places absorb more energy than they give off back to space, so they have an energy surplus. Other places lose more energy to space than they absorb, so they have an energy deficit.

3. Play the following video from NASA.
Part 4:
-
Using the additional images provided on the Student Pages, compare the monthly changes and document them in the table. Note: The only Student Page with an unlabeled date is January 2015.

Credit: NASA/My NASA Data -
Discuss whether the patterns students observe are consistent with your earlier observations.
-
Based on the months you observed, what predictions would you make for the following months: specifically, September and November?
- Will more energy be absorbed in the Northern mid-latitudes in September or November?
- Will the Northern Polar Region absorb or emit more energy in November?
Disciplinary Core Ideas:
Crosscutting Concepts:
- Cause and Effect
- Systems and System Models
- Stability and Change
Science and Engineering Practices:
- Asking Questions and Defining Problems
- Developing and Using Models
- Analyzing and Interpreting Data
- Use evidence to create an explanation.
- Observe the seasonal changes to explain the phenomenon of Earth’s tilt and incoming solar energy.
- How does energy flow in and among the spheres within the Earth System?
- What does it mean that the atmosphere is in a "dynamic balance?"
- How do changes in one part of the Earth System affect other parts of the system?
The Story of Energy in the Earth System
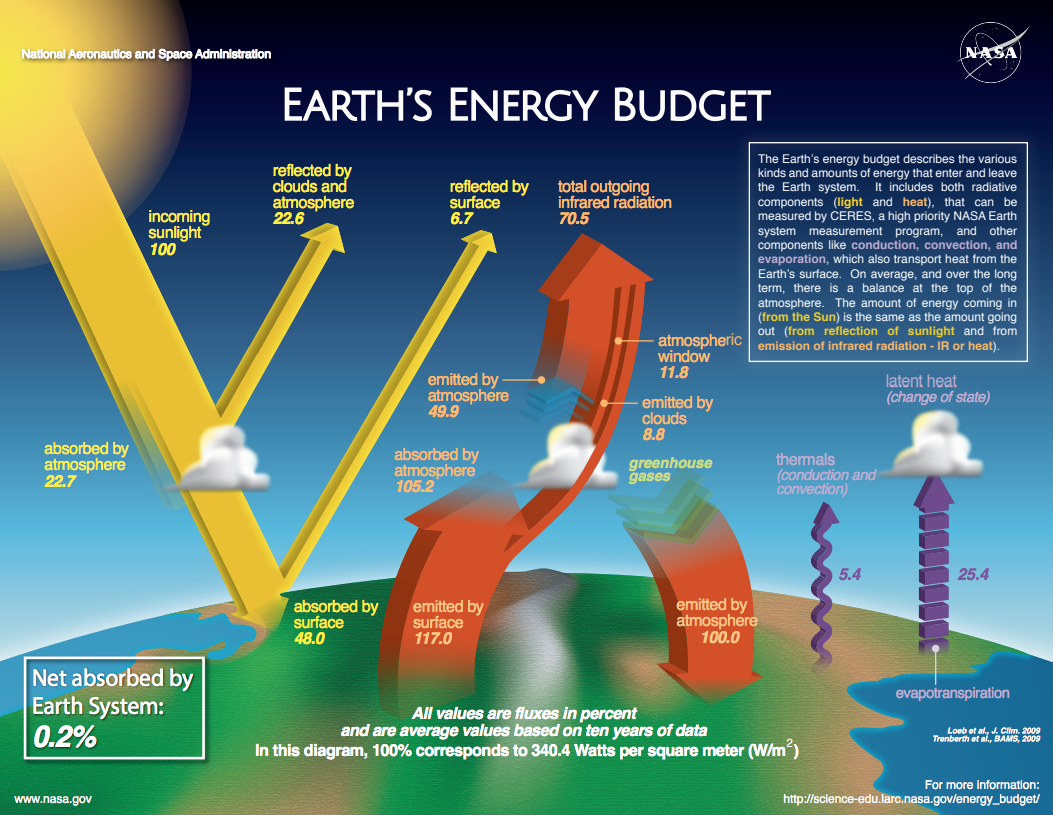
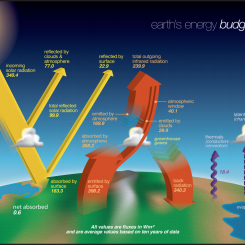
The Sun is the source of energy for the Earth System. This energy reaches Earth primarily in the form of visible light, although it also includes some infrared energy (heat), ultraviolet energy, and other wavelengths of the electromagnetic spectrum. Taking into account night and day and the seasons, on average about 340 Watts of energy enter every square meter of the Earth System. This is slightly less than the energy that six 60 Watt light bulbs would produce, again, for every square meter of the Earth.
As it reaches the Earth System, some of the sunlight is reflected back to space by clouds and the atmosphere (particularly dust particles or aerosols in the atmosphere). A little more sunlight is reflected to space from Earth's surface, particularly from bright regions such as snow- and ice-covered areas. In total, about 30% of sunlight is reflected directly back to space. This percentage is called albedo. About 70% of the sunlight is absorbed by the Earth System (atmosphere and surface) and heats it up.
The elements of the Earth System (surface, atmosphere, clouds) emit infrared radiation according to their temperature, following the Planck function (http://phet.colorado.edu/simulations/sims.php?sim = Blackbody_Spectrum). Cold objects emit less energy; warm objects emit more. This infrared radiation (IR) is emitted in all directions.
Part of the infrared radiation emitted by the atmosphere is directed upward toward space. In fact, an amount of energy equivalent to the amount of sunlight energy absorbed by the Earth System goes back into space through this infrared radiation. This balance exists because the Earth System is in equilibrium. Scientists refer to all of the parts of this equilibrium as Earth's "radiation budget.”
The atmosphere also emits infrared radiation back towards the surface, at a rate of 340 Watts per square meter. Some gases in the atmosphere enhance this downward infrared radiation. This is called the greenhouse effect and is due mainly to water vapor in the atmosphere. Carbon dioxide, methane, and other infrared-absorbing gases enhance this effect. Without an atmosphere and the gases that are part of the greenhouse effect, Earth would have an average temperature of -18 °C, too cold for life as we know it.
At the surface, two additional heat transfer mechanisms operate to balance the system, in addition to the radiation transfer: 1) convection and conduction in the form of thermals which create weather, and 2) a change of state of water through evapotranspiration which also feeds weather.
Just like a family budget for finances, the energy budget of Earth should be balanced.
The simplified equation of a balanced Energy Budget:
Energy In = Energy Out
This balance can be considered at several levels in the Earth System:
a. At the top of the atmosphere, the energy coming in from the Sun is balanced by sunlight reflected back to space and the net infrared (IR) emission from Earth.
The modified equation considering the top of Earth's atmosphere of a balanced Energy Budget:
Sunlight In = Sunlight reflected from clouds/atmosphere + Sunlight reflected from surface + IR emission
b. At Earth’s surface, absorbed sunlight is balanced by the net IR emission and the conduction/convection and evapotranspiration.
The modified equation considering Earth's surface of a balanced Energy Budget:
Sunlight absorbed + IR back radiation (greenhouse effect) = IR emission + Thermals + Evapotranspiration
c. The most complicated balance is in the atmosphere, where absorbed sunlight and energy absorbed from the surface are balanced by the net infrared emission.
The modified equation considering net infrared emission of a balanced Energy Budget:
Sunlight absorbed + IR absorbed + Thermals + Evapotranspiration = IR emitted to space + IR emitted to ground
These balance equations are for an equilibrium state of Earth. Equilibrium would be expected for a planet that has spent a long time in a stable solar system, but sometimes changes occur that take the system out of balance. For example, the ice ages occurred because of long-term changes in Earth’s orbit around the Sun, which resulted in a change to the “Sunlight In” term. Over time, reflected sunlight and IR emission changed to balance the first equation. The result was a colder surface and major glacial advances.
- Locating given geographical locations using latitude and longitude and a world map
- Causes of Earth's seasons and role of its tilt
- “Where Earth's axis of rotation points, with respect to a point in space, changes during the year.”
- “The angle between the Earth's axis and the plane of the Earth's orbit around the sun changes throughout the year.”
- “The orientation of Earth's axis of rotation with respect to the sun does not change during the year.”
- “The intensity of sunlight at a place does not change from day to day during the year.”
- “The amount of time the sun is above the horizon at a given place does not change from day to day.”
Credit: AAAS Science Links
National Geography Standards:
1. How to use maps and other geographic representations, tools, and technologies to acquire, process, and report information from a spatial perspective.
7. The physical processes that shape the patterns of Earth's surface.
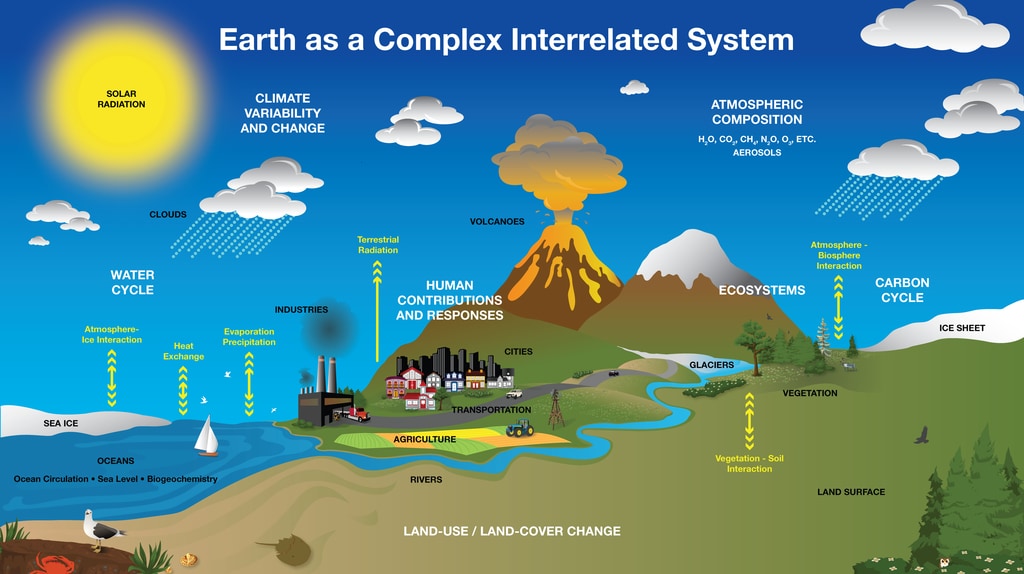
The Sun’s radiation and its interactions with different parts of the Earth System (atmosphere, biosphere, geosphere, hydrosphere) is the foundation of the global climate system. These interactions are key components of global climate models, which are developed by scientists and mathematicians to predict future changes to the climate. Using GLOBE and My NASA Data educators and students can access NASA satellite data to examine a variety of Earth System interactions. In this lesson, Earth’s Energy Budget-Seasonal Cycles, students move through a series of short activities to explore and evaluate Net Radiative Flux data from NASA satellites. In this process, students make qualitative and quantitative observations about seasonal variations in net energy input to the Earth System during the year of 2015.
- Atmospheric and Space Scientists - Investigate weather and climate-related phenomena to prepare weather reports and forecasts for the public
- Computer and Information Scientists - Conduct research in the field of computer and information science
- Remote Sensing Scientists and Technologists - Research a variety of topics using techniques that allow the study of an object or phenomena without making contact directly with the object such as analyzing geological and geographical data. They typically work with aerial or satellite pictures.
- Internet Required
- Teacher computer/projector only
- Color Printer
Complementary Lesson Plans

Complementary Mini Lessons
Complementary Pages


Grade Band
- 9-12
Time
- 90 minutes
Visualization Tool
NGSS Three Dimensional Learning
- See drop-down menu at the bottom of the page