Lesson Plans
Comparing Temperature & Solar Radiation for Common Latitudes
Overview
Examine (daytime) surface temperature and solar radiation received at locations found near similar latitudes using NASA Data.
Materials Required
Per Student:
| Face to Face Instruction | Virtual |
|
Virtual Teachers: Select the form or doc to serve as the Student Sheet. Make a copy of the Google product so that you may assign it directly from your Google Drive into your Learning Management System (e.g., Google Classroom, Canvas, Schoology, etc.). Do you need help incorporating these Google Forms into your Learning Management System? If so, read this ![]() Guide to Using Google Forms with My NASA Data.
Guide to Using Google Forms with My NASA Data.
Per Group of 2 Students:
| Face to Face Instruction | Virtual |
|
Advanced Preparations:
-
Print out the two sets Student Resource Cards for each student group (or distribute to students in content management system (e.g., Google Classroom):
- Monthly Flow of Energy into Earth’s Surface by Solar (Shortwave) Radiation (W/m²)
- Monthly Surface Skin Temperature (Celsius)
-
Write the following locations on the board, if face to face (or display the Google Slide showing the following locations).
- Miami, Florida
- Leon, Spain
- Tokyo, Japan
- Nashville, Tennessee
- Graben, Switzerland
- Asyut, Egypt
- Detroit, Michigan
- Missoula, Montana
Procedure
1. Set the stage for the lesson by showing NASA’s Monthly Daytime Land-Surface Temperature video and ask students to make observations. Have students describe what they see. Generate a list of questions that students have about this.
Monthly daytime land-surface temperatures from February 2000 to 2013 using thermal infrared measurements made by the Moderate Resolution Imaging Spectroradiometer (MODIS) instrument aboard NASA's Terra satellite. Credit: NASA
2. Explain that this visualization shows monthly daytime land-surface temperatures from February 2000 to 2013 using thermal infrared measurements made by the Moderate Resolution Imaging Spectroradiometer (MODIS) instrument aboard NASA's Terra satellite. The measurements shown here represent the temperature of the "skin" (or top 1 millimeter) of the land surface during the daytime—including bare land, snow or ice cover, and cropland or forest canopy—and should not be confused with surface air temperature measurements that are given in a typical weather report. Yellow shows the warmest temperatures (up to 45 degrees Celsius) and light blue shows the coldest temperatures (down to -25 degrees Celsius). Black means no data.
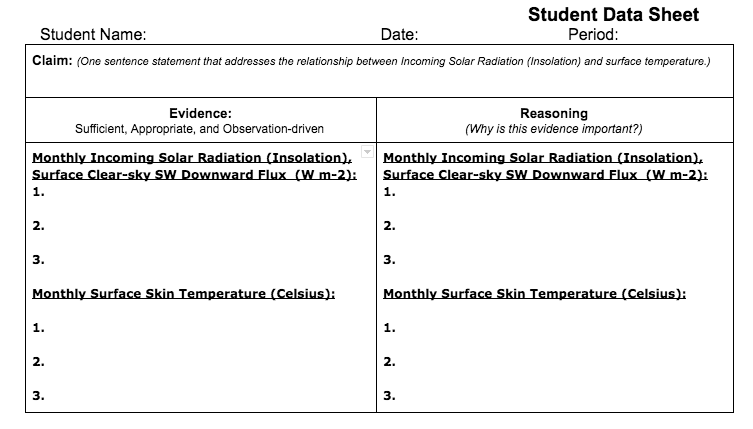
3. Explain to students that they will be analyzing line graphs for two science variables: Incoming Solar Radiation (Insolation) and Surface Skin Temperature. Write these terms on the board.
4. Distribute the Monthly Flow of Energy into Earth’s Surface by Solar (Shortwave) Radiation (W/m2) cards. Take one card to model how to observe the information on the card.
- Bring students attention to the Title, Location, X and Y Axes units. Have students re-read the Title to infer the Label of the axes. Students may write in the labels by the X and Y on the cards.
- Guide students to make observations about the cards and attempt to put these in an arrangement that makes sense to your team. Be prepared to defend your arrangement using evidence from the cards and reasoning.
-
Explain Solar Insolation. These graphs show where and how much sunlight fell on Earth's surface during the time period indicated. The values represent the Watts (a unit of energy flow - Joules per second) that strike over a 1-meter by 1-meter area, averaged over one month. Scientists call this measure solar insolation. Energy from the Sun warms the surface, creating updrafts of air that carry warmth and moisture up into the atmosphere. Knowing the rate of sunlight reaching the surface helps scientists understand weather and climate patterns. Exposure to sunlight is also a key limit to plant growth, particularly in tropical rainforests. Thus, insolation maps are also useful to scientists studying plant growth patterns in different parts of the world. Solar insolation graphs and maps are also useful to engineers who design solar panels and batteries designed to convert energy from the Sun into electricity to power appliances in our homes and workplaces.
5. Tell students that there are four pairs of cards. Now have students analyze all of the Monthly Flow of Energy into Earth’s Surface by Solar (Shortwave) Radiation (W/m2) cards and look for the cards that they believe are similar pairs. (Tips: This can be as open-ended as you like. Students may sort by latitude, longitude, urban, rural, suburban, graphed signatures for maximum and minimum values, etc.)
-
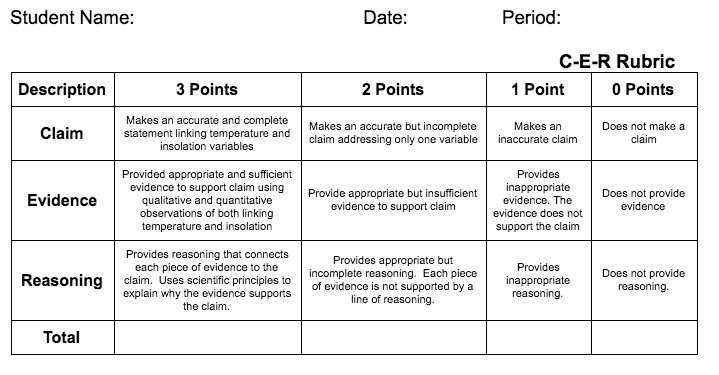
Distribute a Student Sheet and the C-E-R Rubric to each student. Review these with the class. (NOTE: Review Introduction: Building Claims from Evidence before the beginning of the lesson to maximize understanding.)
-
Review the Claim Statement on their Data Sheet and how it needs to connect the phenomenon of insolation with surface temperature.
- Review the kinds of evidence that students will want to collect. (Possible questions guiding their observations may include: How does the amount of solar radiation/temperature at each location compare? What is the detectable pattern in the graph?
-
Encourage students to connect science concepts to our evidence as possible explanations (or reasoning). (Questions may include: What explanation can you give for this pattern? What science principle supports this evidence? etc.)
6. After students get to explore their data, have students arrange the cards by latitude coordinates. These are the imaginary lines on a map that help us identify how far north or south a place is from the equator. Reported as 0-90° North and 0-90° South.
7. Next, direct students to analyze their paired graphs and answer the following questions: How does the amount of solar radiation at each location compare? What is the detectable pattern in the graph? What explanation can you give for this pattern? Based on your solar radiation graph, what would you expect the temperature graph to say?
8. Repeat this process for Surface “Skin” Temperature cards. Explain that this second graph compares the monthly average surface skin temperature at each location. Surface Skin Temperatures are quantitative observations made by remote sensing instruments on satellites that provide the temperature of the topmost layer of the ground. This added value provide information about the land’s surface such as its radiative properties.
9. Have students analyze their paired surface temperature graphs and answer the following questions: How do the temperatures compare between the locations? What is the detectable pattern in the graph? What explanation can you give for this pattern?
-
Have students select one pair of cards to examine and begin observing.
- Students should have found that both locations receive nearly identical amounts of solar radiation. However, their temperatures differ and can do so dramatically. What explanation can you give for this data?
- What other variables, besides solar radiation, can you identify as possibly having an effect on surface temperature?
Disciplinary Core Ideas:
- ESS1C: The History of Planet Earth
Crosscutting Concepts:
- Patterns
- Cause and Effect
Science and Engineering Practices:
- Developing and Using Models
- Planning and Carrying out Investigations
- Analyzing and Interpreting Data
- Constructing Explanations and Designing Solutions
- Students will analyze (daytime) surface temperatures between locations to identify patterns.
- Students will analyze solar radiation between locations to identify patterns.
- Students will examine the patterns and determine variables that may be responsible for differences.
- Why is Earth heated unequally?
- How are surface temperature and solar radiation related?
- What is the relationship between latitude and surface temperature?
Earth’s seasons are caused by a shift of sunlight, which is controlled by Earth’s orbit around the Sun and the tilt of Earth as it rotates on its axis. The 23.5-degree tilt of Earth’s axis results in changes of the angle of incident sunlight.

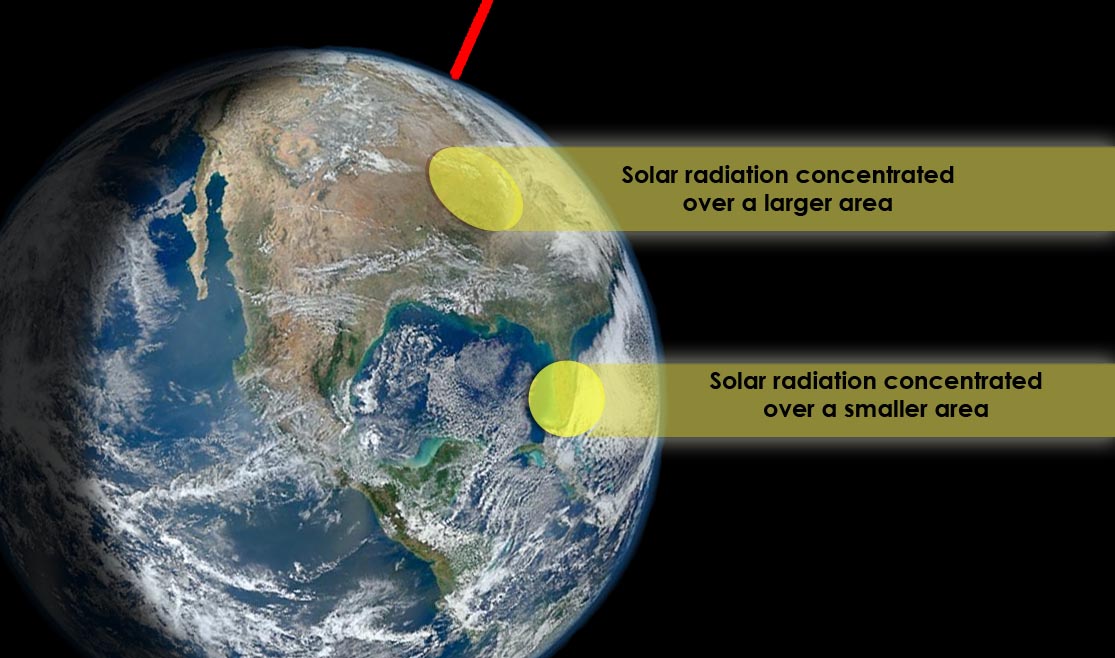
The angle of incoming solar radiation (insolation) influences seasonal temperatures of locations at different latitudes. When the Sun’s rays strike Earth’s surface near the equator, the incoming solar radiation is more direct (nearly perpendicular or closer to a 90˚ angle). Therefore, the solar radiation is concentrated over a smaller surface area, causing warmer temperatures. At higher latitudes, the angle of solar radiation is smaller, causing energy to be spread over a larger area of the surface and cooler temperatures. Because the angle of radiation varies depending on the latitude, surface temperatures on average are warmer at lower latitudes and cooler at higher latitudes (even though higher latitudes have more hours of daylight during the summer months).
Latitude is the most important factor in governing surface temperature. Elevation and availability of moisture, among other variables, can cause temperatures to vary for different locations at the same latitude, even though all points along a latitude line receive the same amount of solar energy. Sunlight warms the soil, rocks, plants, roads, buildings, and bodies of water, all of which then emit the solar energy they absorb in the form of thermal (infrared) radiation that we perceive as heat which is observed as temperature. Surface skin temperatures are quantitative observations made by remote sensing instruments on satellites. Surface skin temperature is the temperature of the topmost layer of the ground. This added value provides information about the land’s surface such as its radiative properties.
To learn more about Earth’s Energy Budget, visit:
Also, for Problem-based Learning Units related to this topic, see “Investigating the Climate System - Energy: https://www.nasa.gov/audience/foreducators/topnav/materials/listbytype/ICS_Energy.html
- Axial Tilt
- Seasons
- Basic ability to read a map
- Understanding of latitude and longitude
- Energy Transfer
- Major terrestrial and aquatic biomes
- Weather and climate
- A common misconception among students is that the seasons are caused by the distance between Earth and Sun. In fact, summer in the Northern Hemisphere occurs at aphelion, the farthest distance between Earth and Sun, and follows summer solstice when incident sunlight is most concentrated along the Tropic of Cancer, 23 degrees 26 minutes 22 seconds North.
- Air temperature is not affected by elevation (AAAS Project 2061, n.d.).
- The maximum height the Sun reaches in the sky on any given day is the same everywhere on Earth (AAAS Project 2061, n.d.).
National Geography Standards:
-How to use maps and other geographic representations, tools, and technologies to acquire, process, and report information from a spatial perspective.
Common Core State Standards ELA Standards:
- CCSS.ELA-LITERACY.RI.6.7: Integrate information presented in different media or formats (e.g., visually, quantitatively) as well as in words to develop a coherent understanding of a topic or issue.
- CCSS.ELA-LITERACY.RI.6.8: Trace and evaluate the argument and specific claims in a text, distinguishing claims that are supported by reasons and evidence from claims that are not.
- CCSS.ELA-LITERACY.RI.7.8: Trace and evaluate the argument and specific claims in a text, assessing whether the reasoning is sound and the evidence is relevant and sufficient to support the claims.
- CCSS.ELA-LITERACY.RI.8.8: Delineate and evaluate the argument and specific claims in a text, assessing whether the reasoning is sound and the evidence is relevant and sufficient; recognize when irrelevant evidence is introduced.
Scientists monitor the Earth System to better understand and meet the challenges of environmental change. For example, knowing how much of the Sun's energy reaches the surface of Earth helps scientists understand dynamics in the spheres within the Earth System, i.e., Atmosphere, Hydrosphere, Cryosphere, and Biosphere. An important variable in understanding these changes is Earth’s surface temperature because the warm air rising off Earth's landscapes influences our world's weather and climate patterns. NASA leads a wide range of efforts to collect and interpret these data acquired from satellites, aircraft, and ground networks, and to integrate these data into numerical models of Earth’s climate at global and regional scales. In this lesson, students will interact with a variety of different Earth models to explore how Earth’s latitude relates to the amount of solar radiation received by Earth.
- Atmospheric and Space Scientists – Investigate weather and climate-related phenomena to prepare weather and climate-related phenomena to prepare weather reports and forecasts for the public
- Computer and Information Scientists – Conduct research in the field of computer and information science
- Cartographers and Photogrammetrists – Collect, analyze, and interpret geographic data in creation of maps
- Standalone Lesson (no technology required)
- Internet Required
- One-to-One (tablet, laptop, or CPU)
- Visualization Tool Required
- Color Printer
Complementary Lesson Plans


Interactive Files
Grade Band
- 6-8
Time
- 90 minutes
Visualization Tool
NGSS Three Dimensional Learning
- See drop-down menu at the bottom of the page