Lesson Plans
Seasonal Science: Building Claims from Evidence
Overview
Students will analyze surface temperature and solar radiation data to construct explanations about the relationship of seasons and temperature to the amount of solar energy received on Earth’s surface. By observing the graphs of these variables collected from three cities: Porto Alegre, Brazil, Quito, Ecuador, and Memphis, TN, students will construct claims about the seasons by using scientific evidence and reasoning.
Materials Required
Per Student:
- Post-it Notes
- Marker
- Student Sheets A,B, C (Student Resources)
- C-E-R Rubric
Per Group of 2 Students:
-
Student Sheet A, B, C (Student Resources)
Per Class:
- Inflatable Globe (Optional)
- Flashlight (Optional)
Procedure
Part 1: Exploring Sunlight
-
Set the stage for learning by telling students that they will observe NASA images and data to construct claims about the seasons. They will be expected to use scientific evidence and reasoning to make a claim about the phenomenon of seasons.
-
Tell students that they will observe a video of the Earth taken by a satellite over the period of one year. Ask students to imagine that they are a videographer standing on the Moon collecting video footage for an entire year. Students should brainstorm what changes they would see over the course of a year.
-
Distribute the KWL+? Chart. Students should write the term “Sunlight” in the K (What do you think you know? What do you think you would see?) column and write out their ideas.
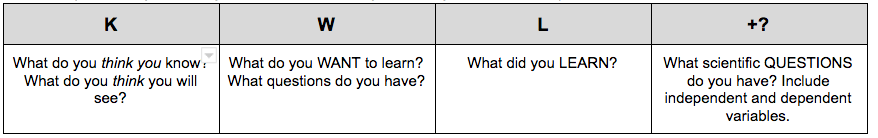
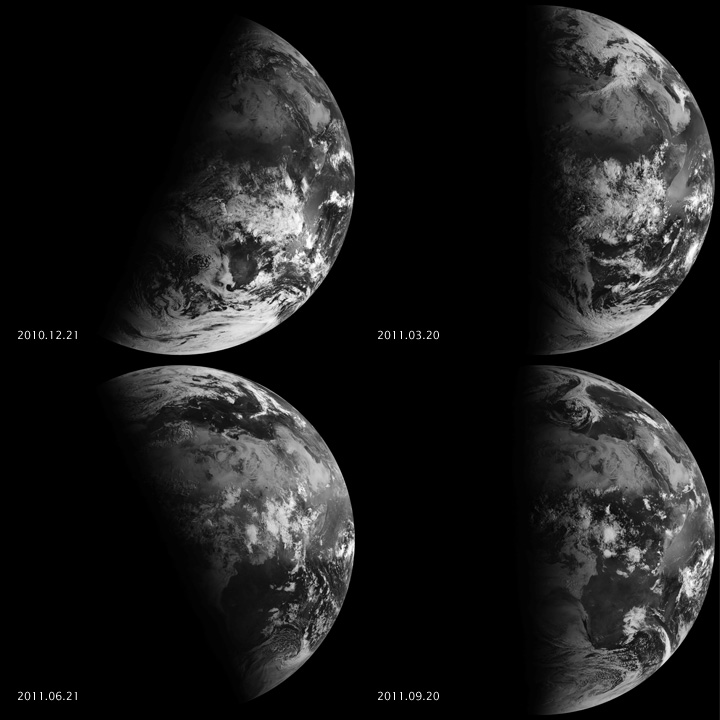
- Display Teacher Resource: “Seeing Equinoxes and Solstices from Space”. Explain to students that these images show evidence of Sunlight on Earth’s surface throughout the year. Ask students to generate questions that they want to explore and write these under the W column (What do you WANT to learn? What questions do you have?).
-
Run the video, Seeing Equinoxes and Solstices from Space.
-
As the video runs, students should return to the KWL and document their observations in the L column.
-
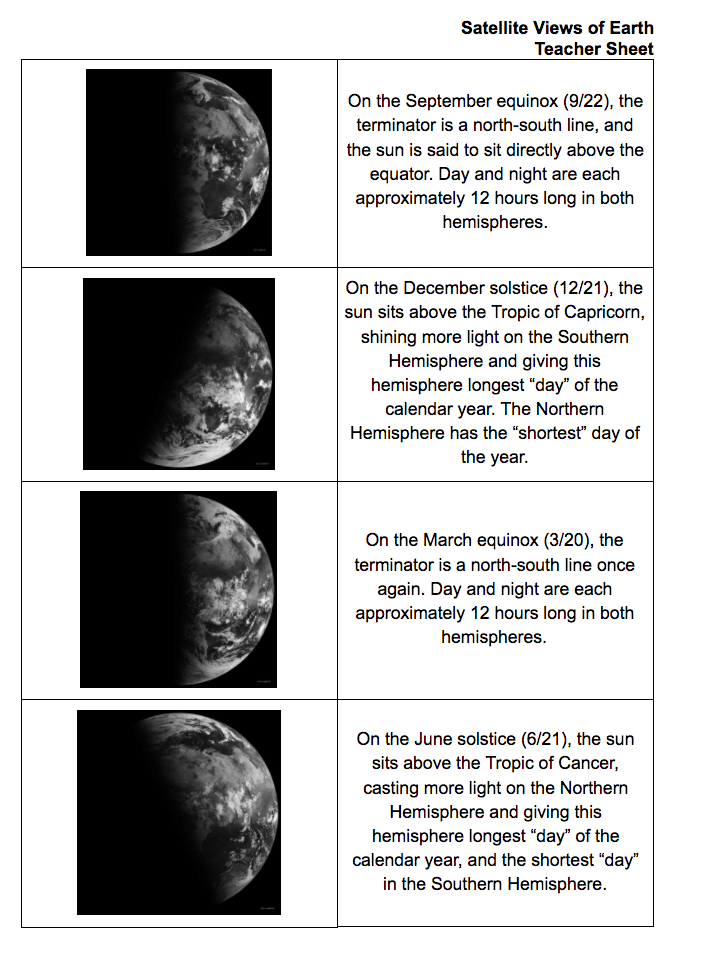
Ask students to describe their observations. What did you observe? What changes did you notice? Is this change cyclical (repeating in a predictable pattern)? If students struggle to observe the changes, review the key talking points on “Satellite Views of Earth” Teacher Sheet.
-
Draw students’ attention to the line where light and dark meet (known as "terminal") and note how the line seems to move over the course of the year at four times. Students should pay attention to the date and time labelled on the left side of the video. Now have student analyze Africa and observe this change over time.
-
Optional: Model this using a flashlight and globe and allow students to replicate the process of the Earth moving through four seasons with the axial tilt. Have students attempt to replicate the images on the screen.
-
-
Next have students brainstorm scientific questions related to this phenomenon. Students should be sure to include an independent and dependent variable. These could include things like: how do temperatures (dependent variable) change over time (independent variable), how is the terminal line (independent variable) related to plant growth (dependent variable), etc. Add these to the +? column.
Part 2: Exploring Solar Radiation
-
Introduce another scientific variable, solar radiation, which is the primary source of energy to the Earth. Tell students that they will observe a video that shows monthly radiation received on Earth from the Sun.
-
Direct students to return to the KWL+? chart’s K and L column. Students should draw a line under the previous section to write their answers and write the term “Solar Radiation”.
-
Direct students to document their observations in the L column as the video runs. View the video NASA: Why does the Sun Matter for Earth’s Energy Budget? (1 min, 39 sec)
-
Ask students to brainstorm new scientific questions that come to mind now that they better understand solar radiation. Add these to the +? column.
-
Introduce solar (shortwave) radiation with students.
-
Now show the animation of Earth’s net radiation as observed by the NASA CERES instrument during 2006 – 2013 (17 secs). (Be sure to show at full screen so the date is clearly visible.) Point out the date at the bottom and the legend. Describe what the colors represent the kilowatt-hours of sunlight falling on every square meter of the surface per day (Watts/m2), averaged over one month.
-
Ask students to predict the changes that they will likely see (e.g., When will we expect to see more orange in the N. Hemisphere vs. S. Hemisphere? Vice Versa. When will we expect to see the hemisphere’s balanced with respect to radiation?, etc.)
-
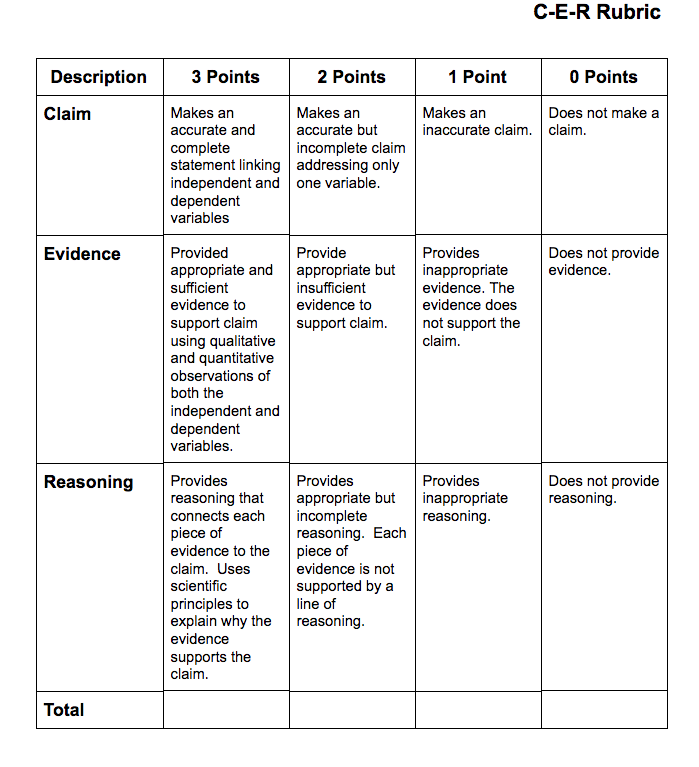
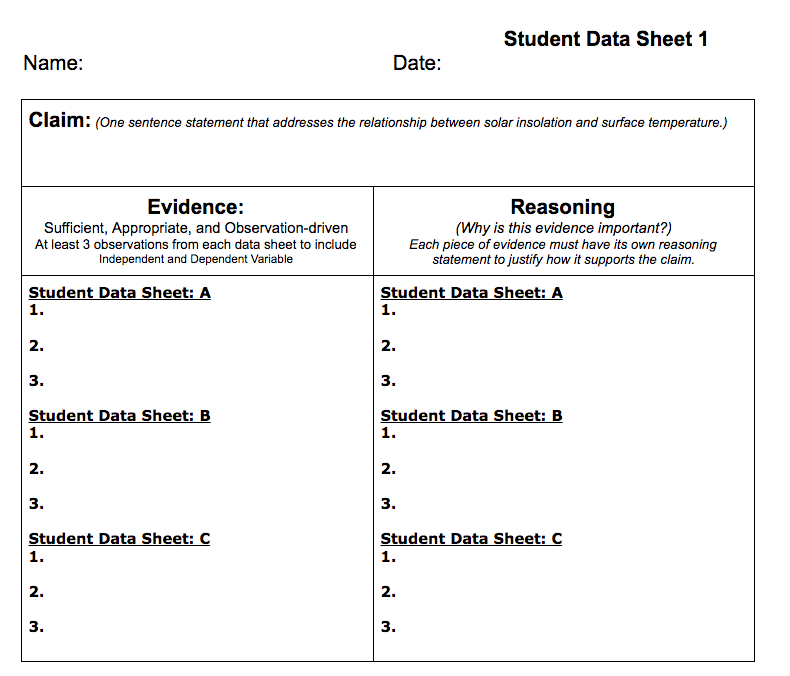
Distribute Student Data Sheet 1 and the C-E-R Rubric and review with students.
-
Direct students to make a claim about the relationship of the seasons with the amount of solar radiation received on Earth and write this at the top of the sheet under “Claim”.
Part 3: Analyzing Evidence to Support Claim about the Seasons
-
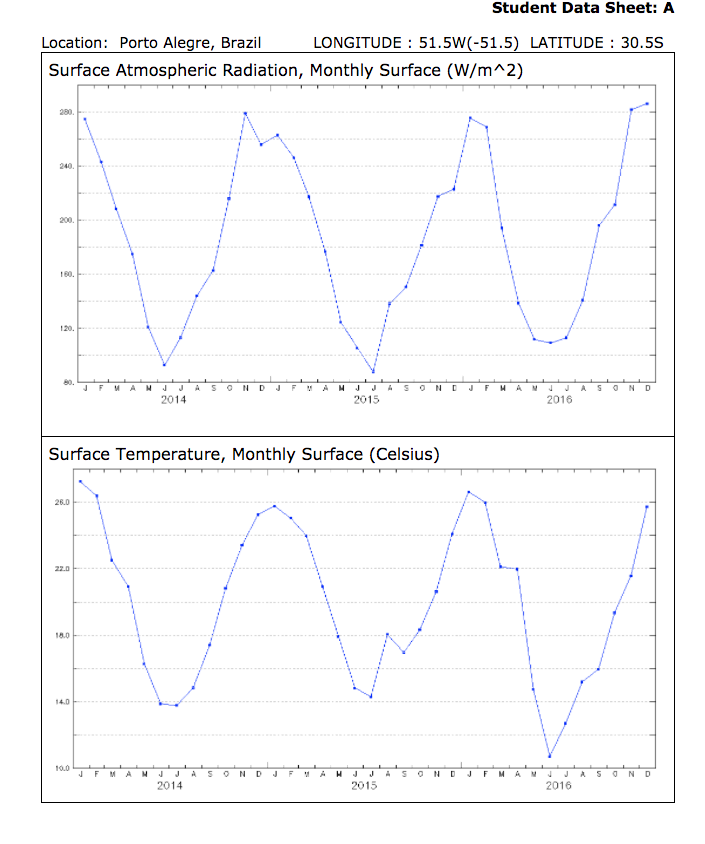
Distribute the Student Data Sheet A (Porto Alegre, Brazil) to student groups. Students will work in teams of two to make observations about the monthly surface temperature and monthly solar shortwave radiation values at Porto Alegre, Brazil over a three year period (2014, 2015, and 2016).
-
Students will document at least three lines of evidence (qualitative and quantitative observations). Students will also connect each line of evidence to their claim in the Reasoning column. Here, they should include scientific principles that support their claim for each line of evidence.
-
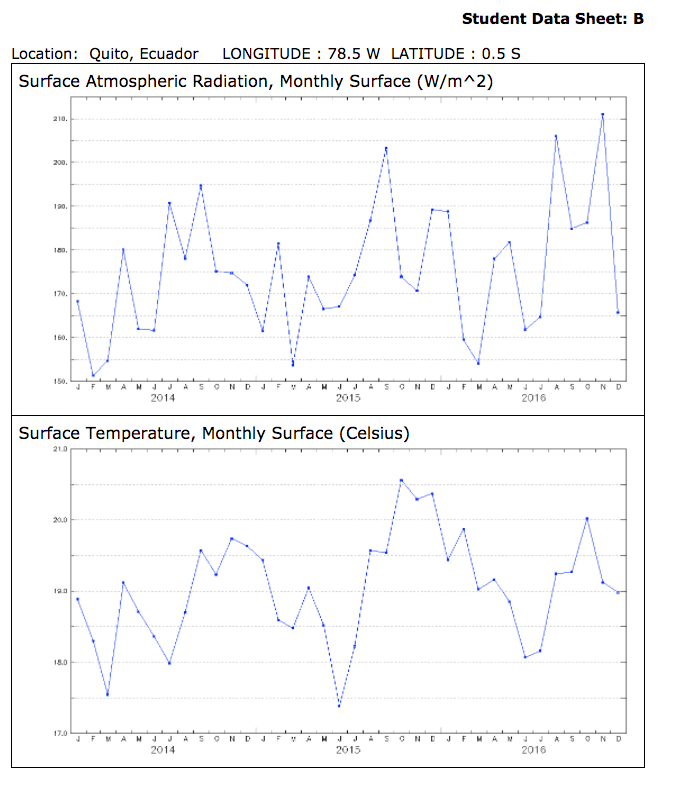
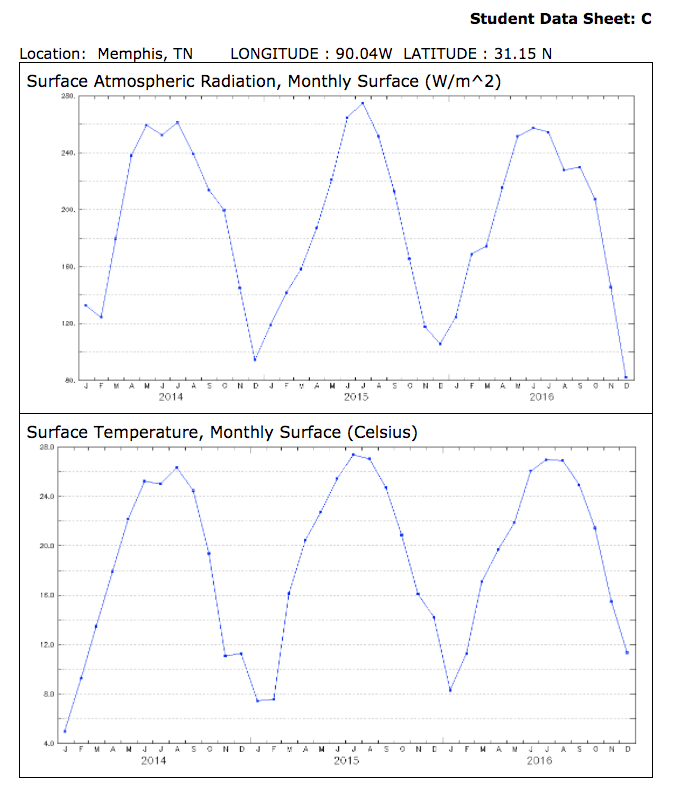
Repeat Steps 1 and 2 for Quito, Ecuador (Student Sheet B) and Memphis, TN (Student Sheet C).
-
Evaluate student work with the C-E-R Rubric. Review the work as a class.
Teachers who are interested in receiving the answer key, please complete the Teacher Key Request and Verification Form. We verify that requestors are teachers prior to sending access to the answer keys as we’ve had many students try to pass as teachers to gain access.
Disciplinary Core Ideas:
Crosscutting Concepts:
- Cause and Effect
Science and Engineering Practices:
- Asking Questions and Defining Problems
- Engaging in Argument from Evidence
- Students will practice the process of making claims, collecting evidence to support claims, and applying scientific reasoning to connect evidence to claims.
- Students will analyze surface temperature and solar radiation data to construct explanations about the relationship of seasons and temperature to the amount of solar energy received on Earth’s surface at three cities: Porto Alegre, Brazil, Quito, Ecuador, and Memphis, TN.
- By observing the graphs of these variables, students will construct claims about the seasons by using scientific evidence and reasoning and will use these to justify their argument.
- What role does Earth’s axial tilt have in the flow of energy through the Earth System?
- How are surface temperature and solar radiation related?
- What role does argumentation have in science?
Earth’s seasons are caused by a shift of sunlight—which is controlled by Earth’s orbit around the Sun and the tilt of the Earth as it rotates on its axis. The 23.5-degree tilt of the Earth’s axis results in changes of the angle of incident sunlight.
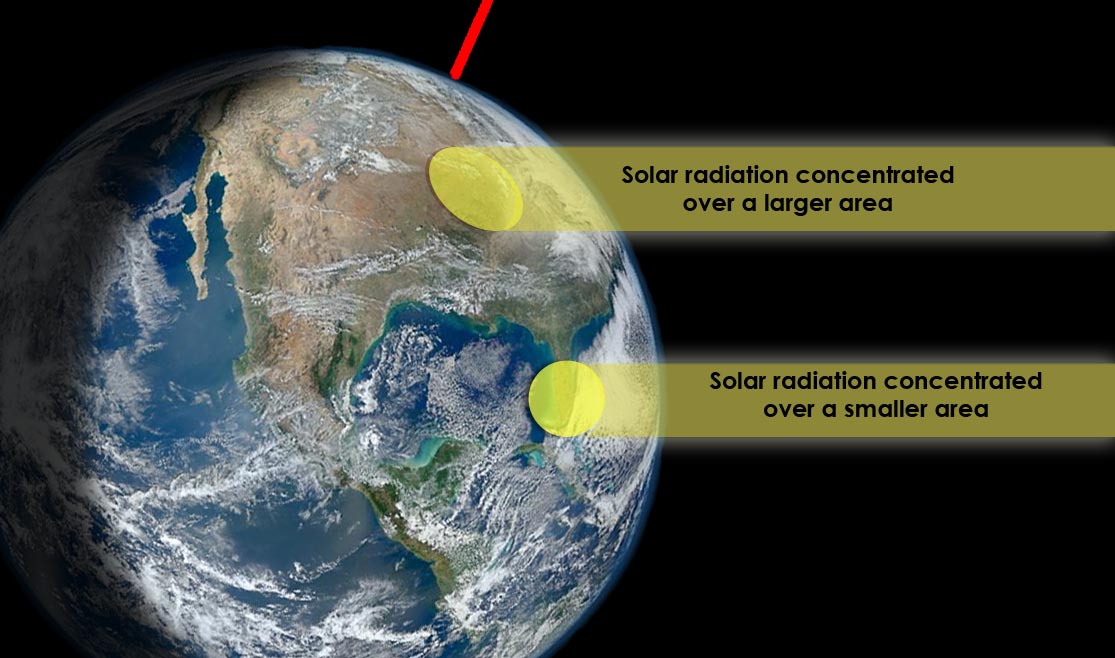
The angle of incoming solar radiation influences seasonal temperatures of locations at different latitudes. When the sun’s rays strike Earth’s surface near the equator, the incoming solar radiation is more direct (nearly perpendicular or closer to a 90˚ angle). Therefore, the solar radiation is concentrated over a smaller surface area, causing warmer temperatures. At higher latitudes, the angle of solar radiation is smaller, causing energy to be spread over a larger area of the surface and cooler temperatures. Because the angle of radiation varies depending on the latitude, surface temperatures on average are warmer at lower latitudes and cooler at higher latitudes (even though higher latitudes have more hours of daylight during the summer months).
Every day, Sun’s energy enters the Earth system when sunlight penetrates the top of the atmosphere. Energy goes out in two ways: 1. reflection by clouds, aerosols, or the Earth's surface; and 2. thermal radiation—heat emitted by the surface and the atmosphere, including clouds. The rest of the light is absorbed by the atmosphere, land surfaces and oceans, and this absorption keeps Earth warm. The difference between how much solar energy enters the Earth system and how much heat energy escapes into space is called "net radiation," sometimes called net flux; it is the balance between incoming and outgoing energy at the top of the atmosphere. Some places absorb more energy than they give off back to space, so they have an energy surplus. Other places lose more energy to space than they absorb, so they have an energy deficit. The oceans and atmosphere continually move energy from regions with an energy surplus to regions with an energy deficit. Net radiation is the total energy that is available to influence the climate. The global average net radiation must be close to zero over the span of a year or else the average temperature will rise or fall.
To learn more about the Earth’s Energy Budget, check out NASAeClips Real World: Earth's Energy Balance - Energy In and Energy Out
- Ability to read a map
- Understanding of latitude and longitude
- Energy Transfer
- Revolution and orbit (Earth travels around the Sun)
-
A common misconception among students is that the seasons are caused by the distance between the Earth and Sun. In fact, summer in the Northern Hemisphere occurs at aphelion, the farthest distance between the Earth and Sun, and follows summer solstice when incident sunlight is most concentrated along the Tropic of Cancer, 23 degrees 26 minutes 22 seconds.
National Geography Standards:
- How to use maps and other geographic representations, tools, and technologies to acquire, process, and report information from a spatial perspective.
Common Core State Standards ELA Standards:
- CCSS.ELA-LITERACY.RI.6.7
- Integrate information presented in different media or formats (e.g., visually, quantitatively) as well as in words to develop a coherent understanding of a topic or issue.
- CCSS.ELA-LITERACY.RI.6.8
- Trace and evaluate the argument and specific claims in a text, distinguishing claims that are supported by reasons and evidence from claims that are not.
- CCSS.ELA-LITERACY.RI.7.8
- Trace and evaluate the argument and specific claims in a text, assessing whether the reasoning is sound and the evidence is relevant and sufficient to support the claims.
- CCSS.ELA-LITERACY.RI.8.8
- Delineate and evaluate the argument and specific claims in a text, assessing whether the reasoning is sound and the evidence is relevant and sufficient; recognize when irrelevant evidence is introduced.
The natural phenomenon of seasons is a predictable event that never ceases to amaze many with the changes of fauna and flora that it brings. But why is it that when the Earth is closest to the sun, the Northern Hemisphere has winter? And when they are farthest from the sun, they have summer? This phenomenon occurs because of Earth’s tilt, which causes the seasons to occur and thus the climate of that region.
NASA scientists use data from multiple satellites to analyze data to answer questions related to Earth’s axial tilt and seasonal change. GLOBE and My NASA Data enable educators and students to connect with NASA scientists and access the satellite data to answer these questions using solar radiation and surface temperature data. In this lesson, Seasonal Science: Building Claims from Evidence, students will observe patterns of monthly solar radiation and compare these values to average monthly temperatures. Students will make a claim as to how these two variables are related and collect evidence to justify their claims.
- Atmospheric and Space Scientists – Investigate weather and climate-related phenomena to prepare weather and climate-related phenomena to prepare weather reports and forecasts for the public
- Computer and Information Scientists – Conduct research in the field of computer and information science
- Cartographers and Photogrammetrists – Collect, analyze, and interpret geographic data in creation of maps
- Standalone Lesson (no technology required)
- Internet Required

Interactive Files
Grade Band
- 6-8
Time
- > 90 minutes
Visualization Tool
NGSS Three Dimensional Learning
- See drop-down menu at the bottom of the page
Related Resources
- Seeing Equinoxes and Solstices from Space
- NASA: Why does the Sun Matter for Earth’s Energy Budget?
- Net Radiation
- Optional: Eyes on the Earth (NASA App) - must be downloaded in advance
- Optional: The Florida Atlantic Unversity's Seasons Simulator (Flash Required)
- Data Literacy Cube Guide
- Instructional Strategies for the Earth Science Classroom