Mini Lesson/Activity
Evaluating Natural and Human Activities Effects on Earth's Climate
Overview
In this mini lesson, students analyze a bar graph showing the relative forcings from natural and human factors that affect Earth's climate. They use information from this graph to assess the relative importance of these factors.
Student Directions
What happens when the amount of energy entering into the Earth system does not equal the amount that exits? This is a simple question with a complicated answer.
Imbalances in the Earth's Energy Budget are called radiative forcings. They cause chemical and physical changes in the Earth system that impact the climate. An example of this imbalance is the current trend in Earth's Energy Budget; the Earth system has more energy entering than leaving (called a "positive forcing"). Conversely, if more energy exits than enters the system, the planet would cool ("negative forcing").
Energy into Earth - Energy leaving Earth = Radiative Forcing Amount
Prior to the Industrial Revolution, the radiative forcing was nearly balanced, and Earth's atmosphere was relatively stable. Scientists use a year prior to this era, 1750, as a baseline. This baseline year is used to compare radiative forcings and measure the impact of anthropogenic activities of modern times that affect our climate. See the chart below to identify and analyze the warming or cooling effects of these forcings. Notice that there are two main categories: anthropogenic (human-caused) and natural.
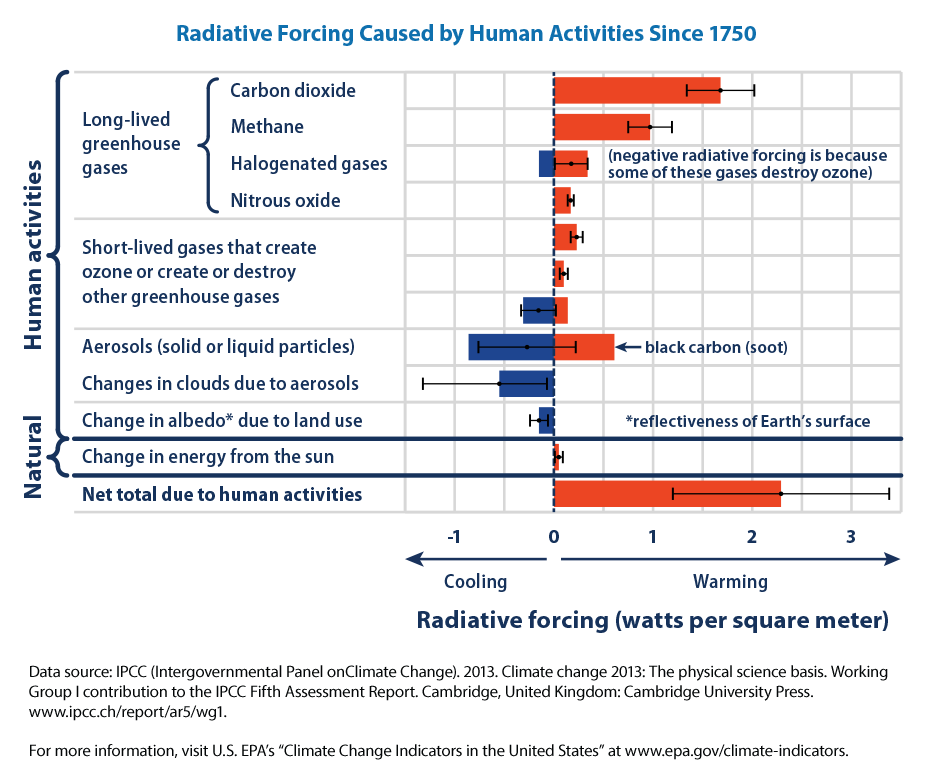
Credit: EPA
https://mynasadata.larc.nasa.gov/sites/default/files/2021-10/climate-forcing-download2-2016.png
Steps
- Review the chart above and answer the following questions. Check with your instructor on how to submit answers.
- What is the net total value of radiative forcing (in watts per square meter) of natural activities? Anthropogenic (human) activities?
- Of the anthropogenic activities, which factor has the greatest value? What category does this belong to?
- Which of the factors have both a cooling and warming effect on climate?
- Why is the year 1750 selected as a baseline?
- What are three questions that you can ask of this chart?
Source:
- Climate Change Indicators: Climate Forcing | US EPA. (2021, July 21). US Environmental Protection Agency. Retrieved May 13, 2022, from https://www.epa.gov/climate-indicators/climate-change-indicators-climat…
Teacher Note
Teachers, these mini lessons/student activities are perfect "warm up" tasks that can be used as a hook, bell ringer, exit slip, etc. They take less than a class period to complete. Learn more on the "My NASA Data What are Mini Lessons?" page.
Teachers who are interested in receiving the answer key, please complete the Teacher Key Request and Verification Form. We verify that requestors are teachers prior to sending access to the answer keys as we’ve had many students try to pass as teachers to gain access.
Disciplinary Core Ideas:
- ESS2A: Earth Materials and Systems
- ESS3C: Human Impacts on Earth Systems
- ESS3D: Global Climate Change
Crosscutting Concepts:
- Cause and Effect
- Scale, Proportion, and Quantity
- Stability and Change
Science and Engineering Practices:
- Developing and Using Models
- Analyzing and Interpreting Data