Interactive Models
Modeling Cloud Cover
Overview
This activity will help students better understand and practice estimating percent cloud cover.
Directions

Overview:
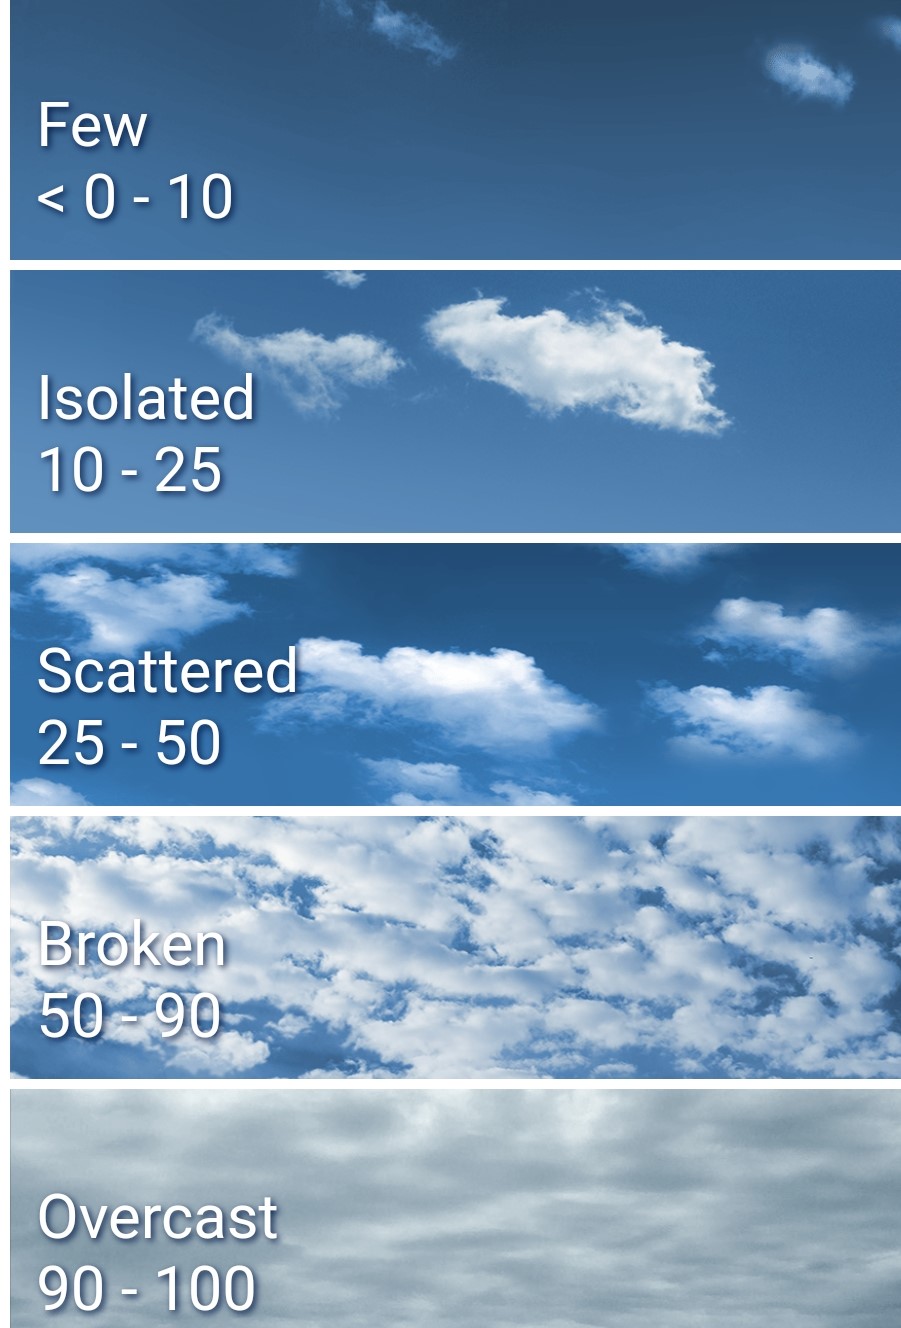
This lesson is designed to help students approximate and estimate percent cloud cover of a particular area. The image above shows different classifications of cloud cover, which students should be able to identify and estimate in peers' finished products at the end of the lesson.
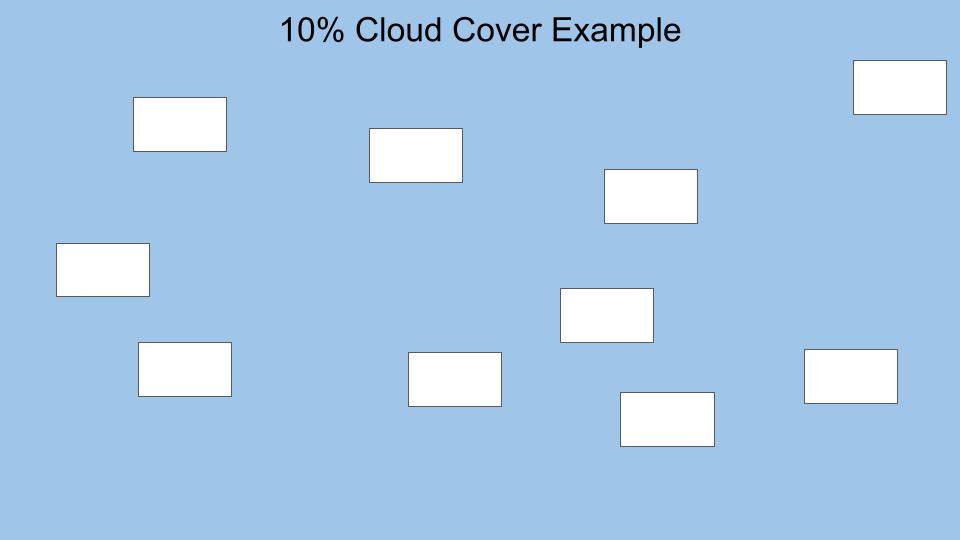
Below is an example of 10% Cloud Cover using this method.
Directions:
- After reviewing the first few slides, choose a percentage of cloud cover to create your own cloud cover example.
- Using the Interactive Google Slides, select a percentage as a multiple of 10% (or fraction) of cloud cover to represent. Slide 5 has rectangles at the bottom to use. Each "stack" has 10 rectangles and represents 10% (or 1/10) cloud cover.
- Move the rectangles onto the blue background on Slide 5, using all the rectangles in each "stack" selected.
- Follow instructor directions to share your slide with other students and estimate cloud cover percentages for other students' slides.
- Identify whether the example you created shows clear, few, isolated, scattered, broken, or overcast cloud cover. (The categories are detailed on Slide 6.)
- On Slide 7, match the cloud cover categories with real citizen science cloud photos.
- Finally, look at different cloud cover models on Slide 8 and discuss the benefits and limitations of each.
Teacher Note
These slides are made to be used in edit mode so that items can be dragged and dropped. Do NOT use presentation mode.
Follow the directions on each slide.
This lesson was modified from the in-person GLOBE Learning Activity: Estimating Cloud Cover: A Simulation. See the original lesson for more ideas.
Teachers who are interested in receiving the answer key, please complete the Teacher Key Request and Verification Form. We verify that requestors are teachers prior to sending access to the answer keys as we’ve had many students try to pass as teachers to gain access.
- Standalone Lesson (no technology required)
- Internet Required
- One-to-One (tablet, laptop, or CPU)
- One-to-a-Group


