Lesson Plans
An Earth System View of Earthrise
Overview
Students are introduced to the Earthrise phenomenon by seeing the Earth as the Apollo 8 astronauts viewed our home planet for the first time from the Moon. They will analyze a time series of mapped plots of Earth science variables that NASA monitors to better understand the Earth System. Students will document changes of a variable over time as they create a new visualization. They will share this visualization with a peer who has monitored a different Earth System variable and work collaboratively to make observations about temporal and spatial change making inferences about how these variables may be related. As a result, they develop research questions which students may use in future investigations.
This lesson can be used as a launching activity for introducing Earth Systems or the phenomenon of Earthrise.
Materials Required
Per Student:
Virtual:
- Interactive Google Slide
- Earth System Satellite Images Google Slides
- Chrome Canvas: This is a chrome drawing app that allows you to create and use multiple layers in a drawing. For virtual learners, this app will be used in place of Student Data sheet: Earthrise Map Inventory.
- Image
In person:
- NASA Earthrise in photos: Photograph #1: and #2 (shown only one at a time) on projector
- Sticky notes
- Coloring pencils or crayons (six different colors)
- red, yellow, green, blue, purple, brown
- Student Data sheet: Earthrise Map Inventory
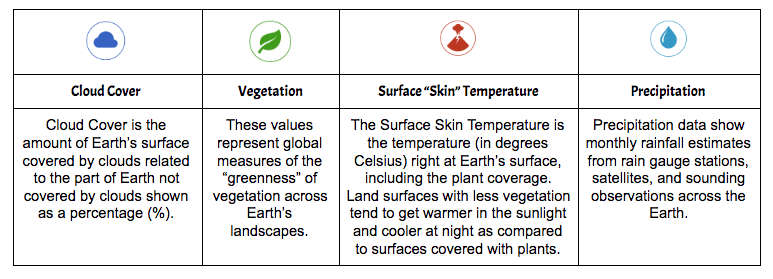
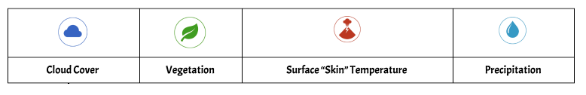
- Earth System Satellite Images (Variable Full Set includes: Cloud Cover, Vegetation, Surface “Skin” Temperature, and Precipitation for dates: January, March, May, July, September, November
Procedure
Introduce Earthrise
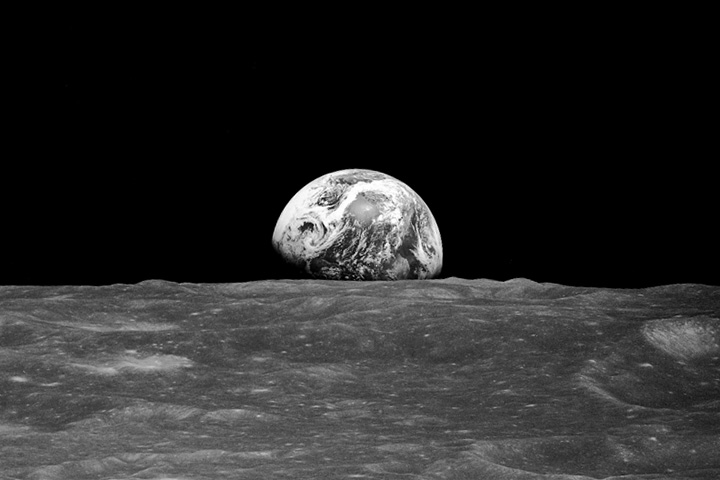
Display the iconic Earthrise Photograph #1 (black and white) to the class. Present the following questions to students to answer:
- What are the main features of the picture?
- Describe the different environments displayed in the photograph.
- How are they similar?
- How are they different?
-
Have students work with a partner to analyze the image and share their observations.
-
Next, students work with their partner to make inferences about the photograph by presenting the following questions to answer:
- Where is this picture taken from? How do you know?
- What is happening in the picture?
- What is most notable about these environments?
-
Now, present Earthrise photograph #2 (in color) and have them observe the photo for new observations and inferences.
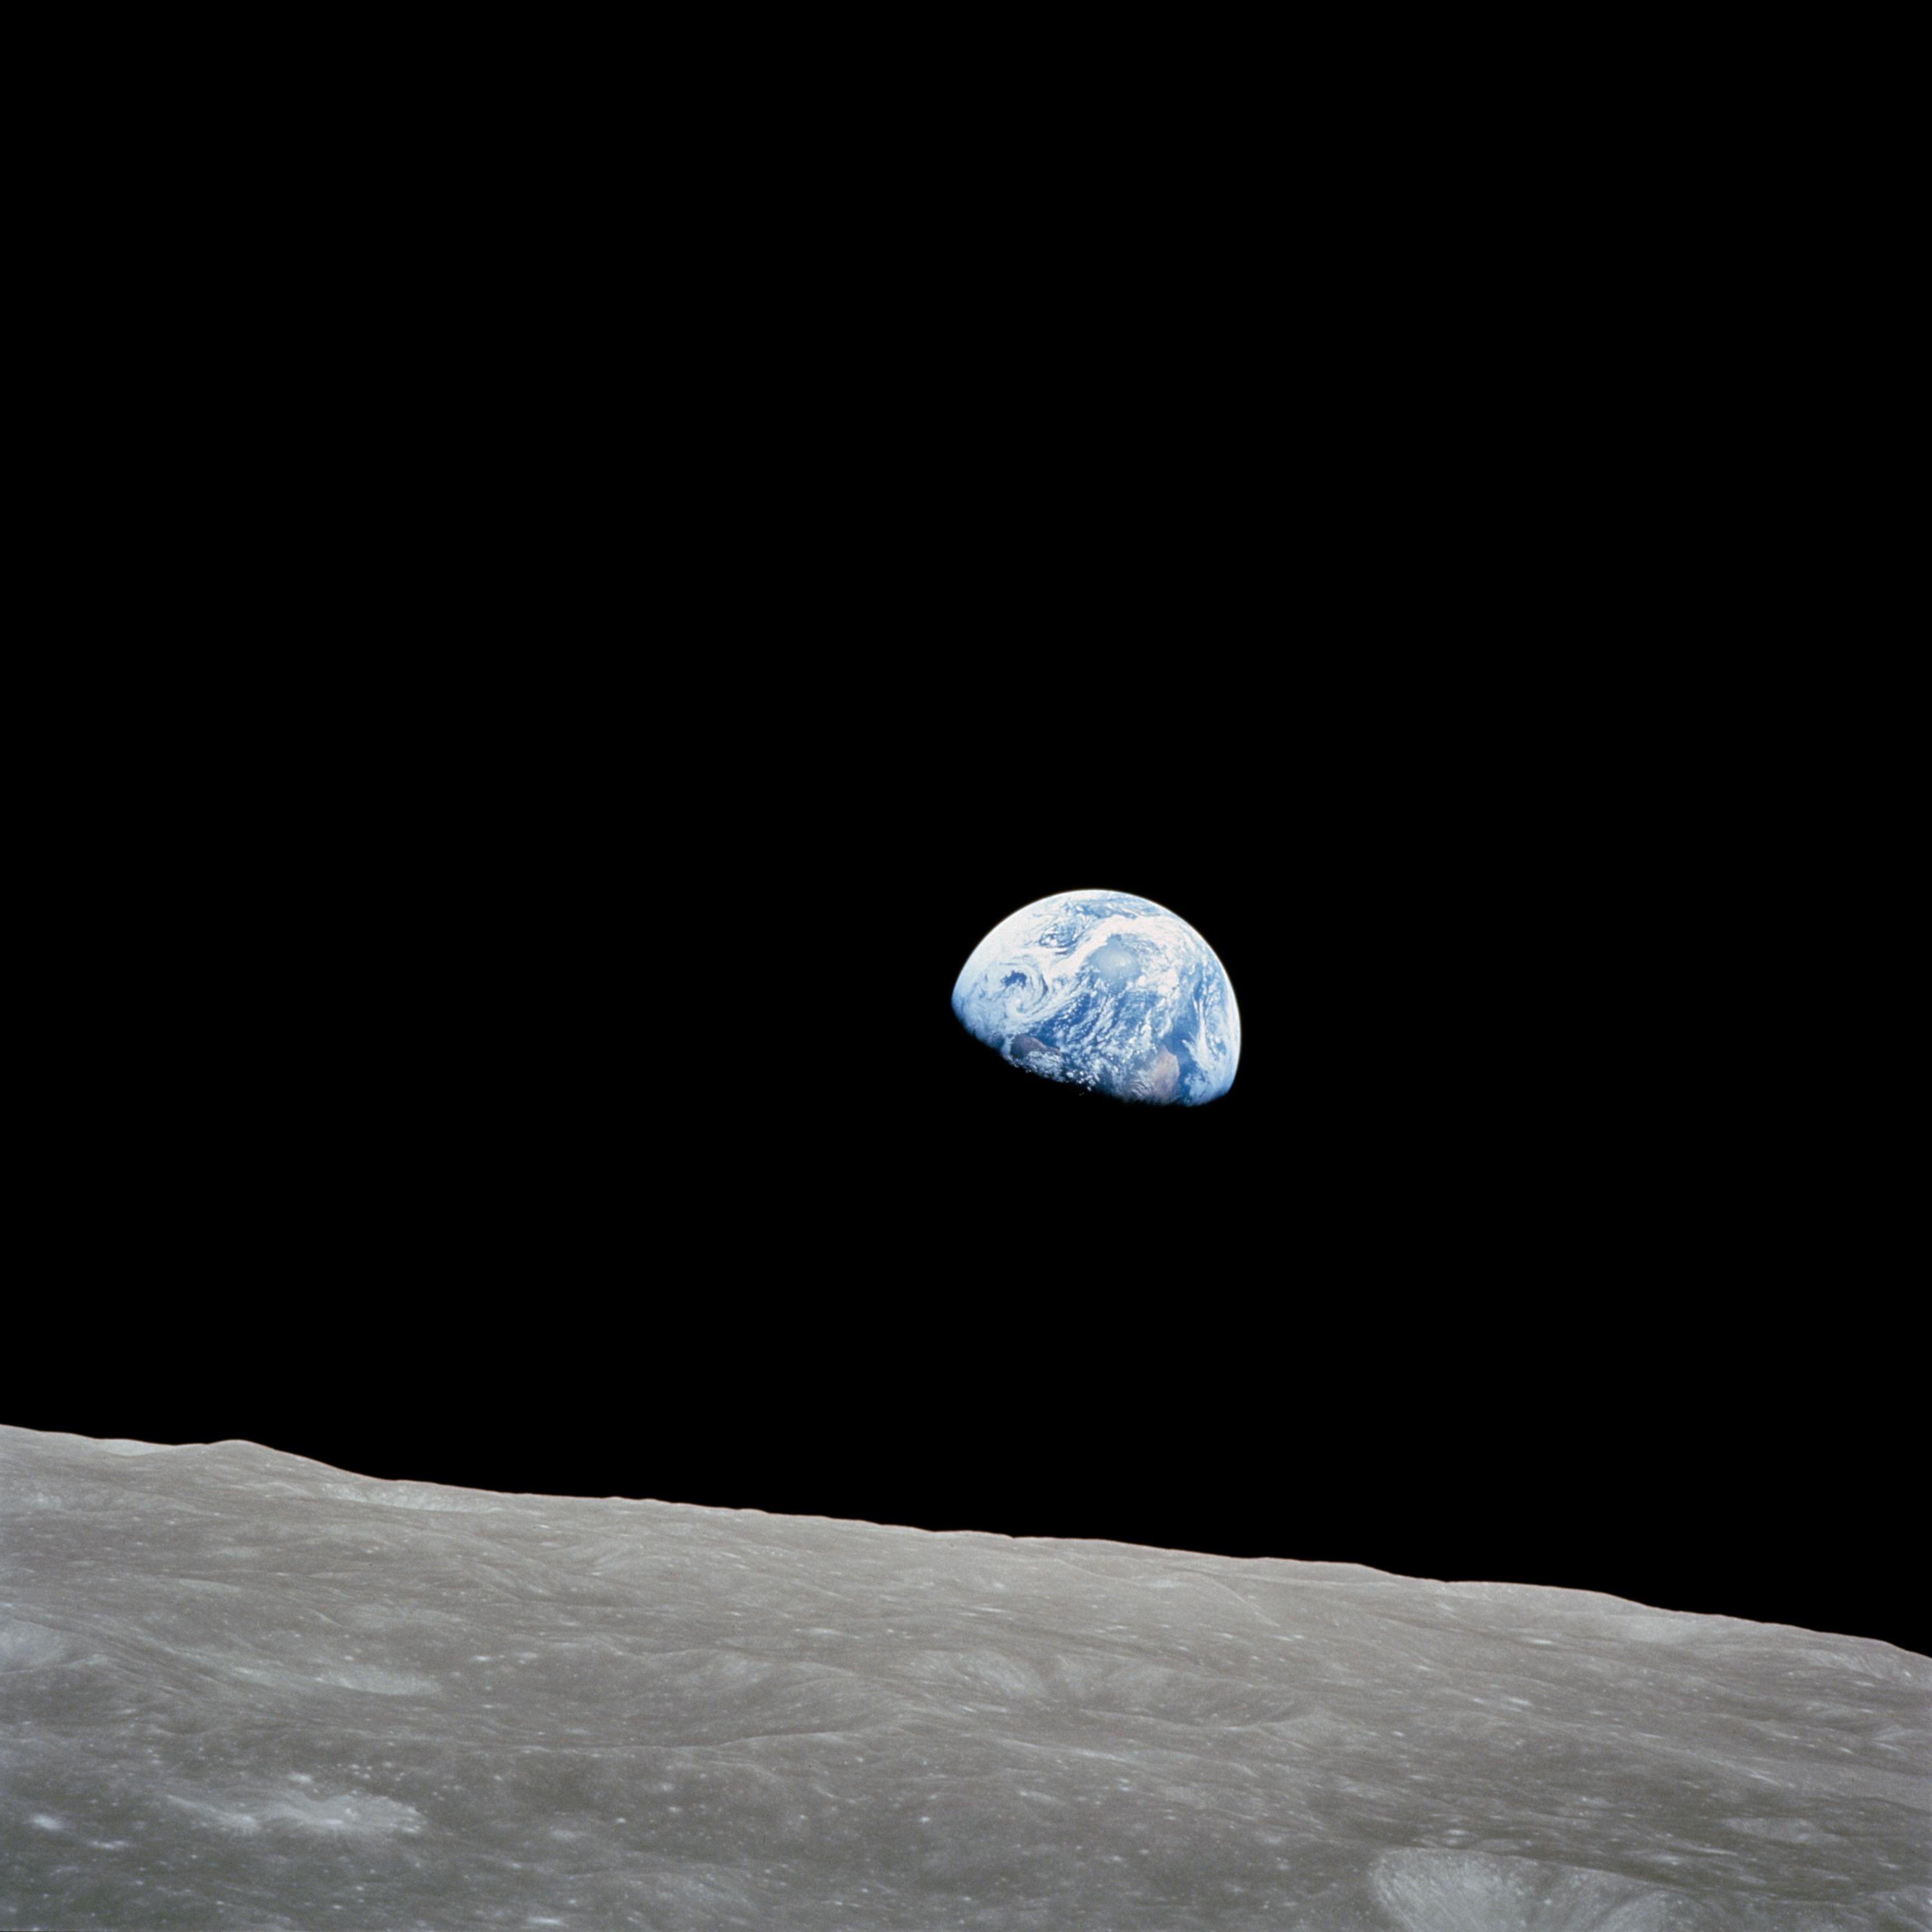
Photograph 2. Earthrise in color (1968) -
Describe the different environments displayed in the photograph.
- How are they similar?
- How are they different?
- What is most notable about these environments when viewing in color?
-
Explain to students that Photograph #1 and 2 were captured on December 24, 1968, from astronauts aboard Apollo 8, the first ever manned satellite of another world. Although it is not the first image of Earth taken from space, it is the first image of the Earth taken from the perspective of Earth rising above the horizon of another world. Apollo 8 astronauts Frank Borman, James Lovell, and William Anders were coming around from the far side of the Moon on their fourth orbit. William Anders photographed the Moon from the right side window of the spacecraft and exclaimed: “Oh my God, look at that picture over there! There’s the Earth comin’ up. Wow, is that pretty!”
For more information about the Apollo 8 mission and the Earthrise photograph, check out the Earthrise: What It's Like to Escape Our Planet | Op-Docs in the Recommended Resources (section on Earthrise photo, as explained by the NASA astronauts on Apollo 8, 14:05-16:45).The second image is the first photograph of Earth in color taken as Earth rose above the lunar horizon. This photograph became one of the most famous photos from all of the Apollo missions and one of the most reproduced space photographs of all time. It has been credited for inspiring the beginning of the environmental movement as this view underscored the need to better understand and protect the Earth. In Life Magazine's 100 Photographs that Changed the World edition, wilderness photographer Galen Rowell called Earthrise, "the most influential environmental photograph ever taken."
-
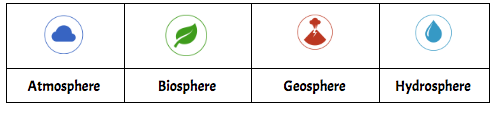
Ask students to brainstorm and share what new information the color photograph provides about our home planet. What may these colors represent? What sphere in the Earth System do they belong? Direct students to connect their descriptions of the natural phenomena to the observed color, as well as to the name of the sphere in the Earth System which they belong.
- Blues:
- Whites:
- Reds:
- Browns:
- Greens:
Activate Prior Knowledge
Now that you have explored the Earthrise photographs depicting Earth from a point of view of the moon, let's explore what you know about Earth from your own perspective.

- Present the following question, “What did you see outside in nature on your way to school today?”
- Students work in their teams to brainstorm the various parts of the system that you’ve encountered today.
- Students will write each idea on a sticky note.
- Have students come to the front of the board and place their sticky note.
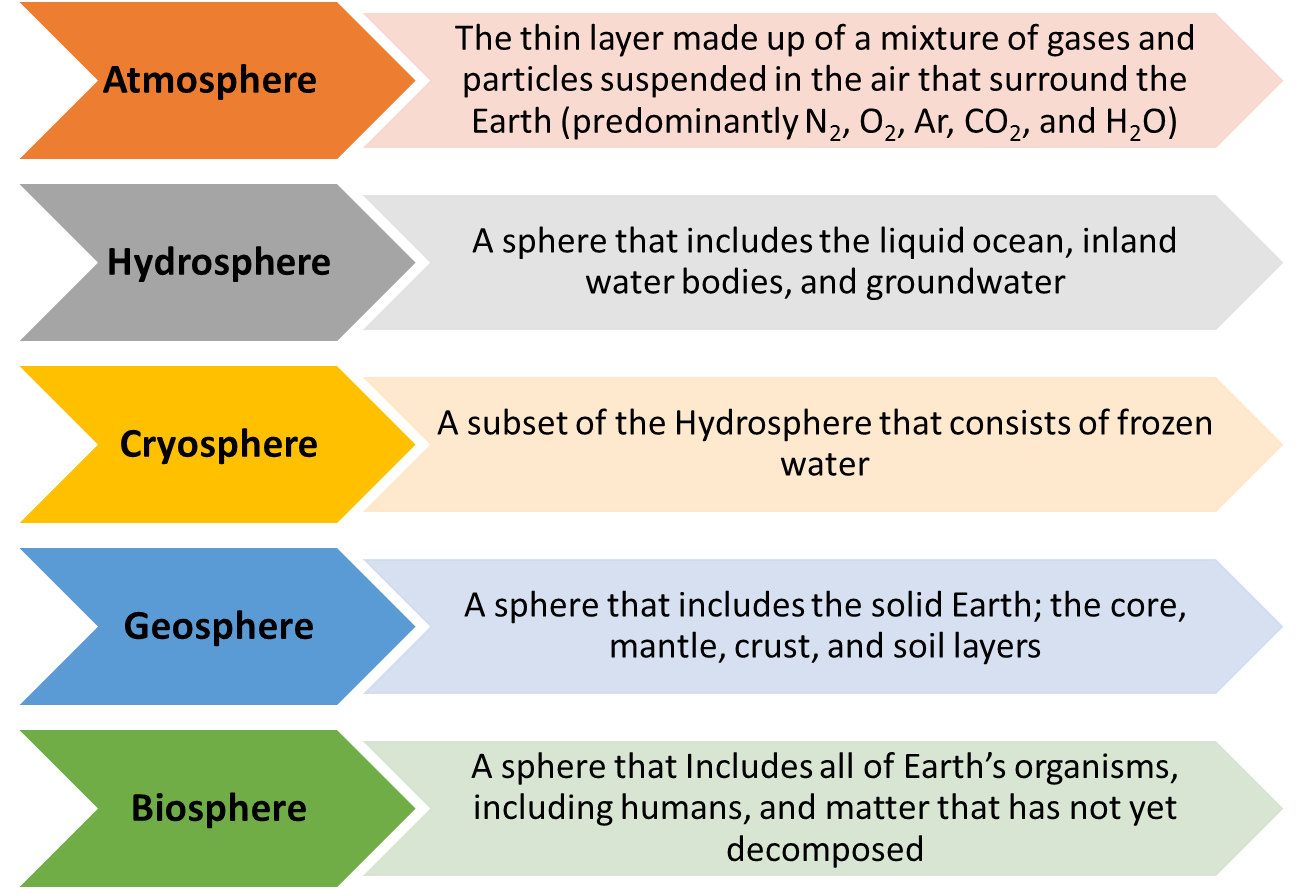
- As a class, review and sort their ideas about different parts of nature that they have encountered into the four major spheres of the Earth System. NOTE: During this activity, we will focus on the Atmosphere, Biosphere, Geosphere, and Hydrosphere. For the purpose of this activity, we will consider the Cryosphere as part of the Hydrosphere.
- Organize the notes under the following headers, after the students have identified the spheres through class discussion.
Part 1: Explore Time Series Satellite Images
Building from your observations on your way to school, use the satellite images to observe these variables on a longer time scale and from a different perspective just like NASA scientists do. Earth System Satellite Images are tools that help us observe change in certain scientific variables among different Earth System spheres.
-
Distribute satellite images of the four variables among students.
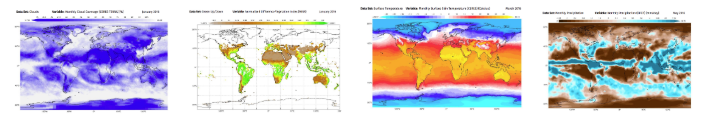
Review the variables being researched:
-
Each student should receive the satellite images of the following months and associate colored pencils to review and analyze:
- January - red
- March - yellow
- May - green
- July - blue
- September - purple
- November - brown
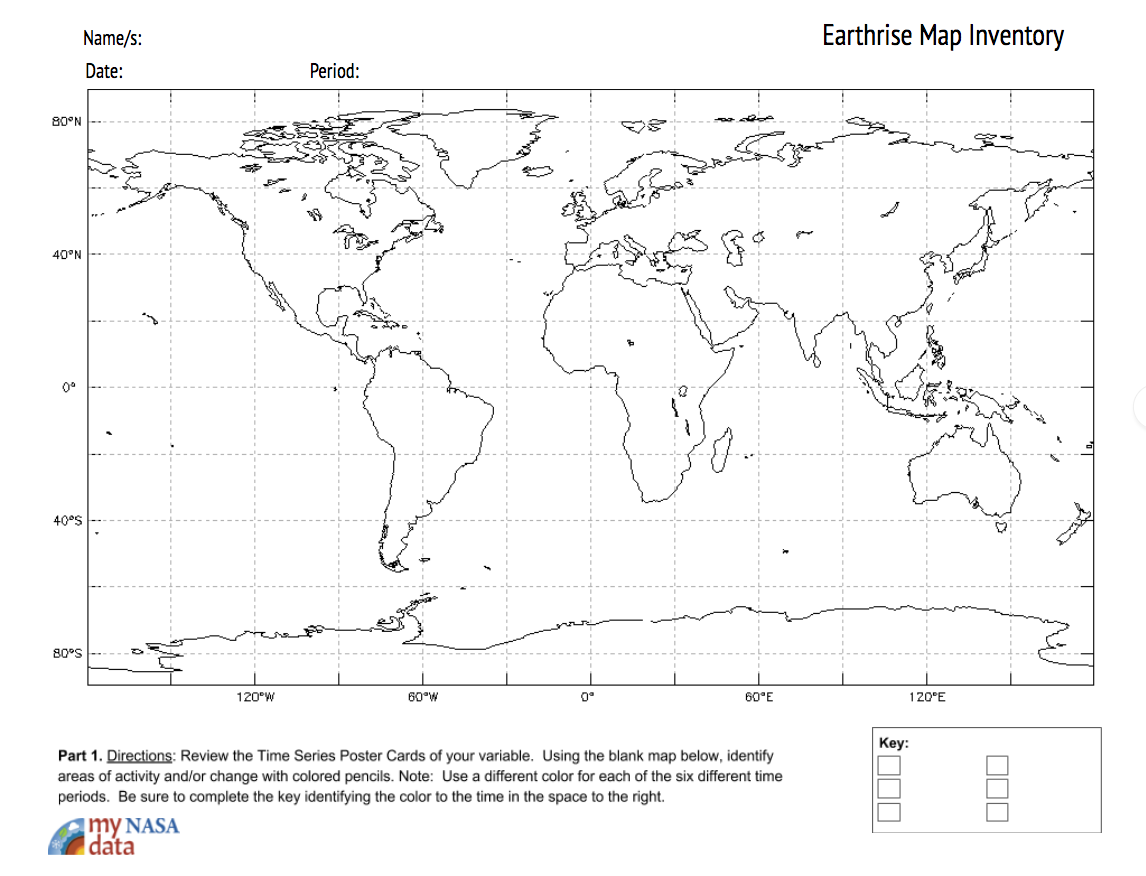
- Distribute the Earthrise Map Inventory, Part 1 & 2 Student Sheet to each student, as well as coloring pencils (six different colors per student - or groups to share).
- Students should review the Earth System Satellite Images of their variable.
- Students should create a key identifying the color to the time in the space to the right.
-
Using the blank map provided (and coloring pencils), students document areas of activity and/or change of their variable. Note: They should use a different color pencil for each of the six different time periods. For virtual learners, use Chrome Canvas. For example, students will identify areas of high values for each of the months, starting with January. Students use a colored pencil to shade these regions. Next, they analyze the satellite images for March and document (on the same sheet) the locations of the high concentrations using a different colored pencil. Repeat this process for each of the months. After repeated updates to the same map, geographic “hot spots” will become obvious, as well as months that experienced a shift in geographic range.
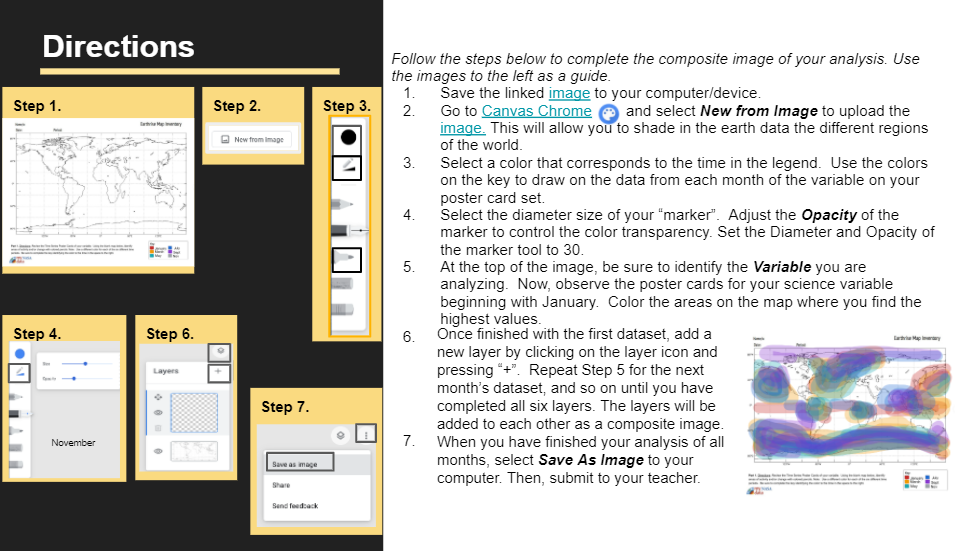
See Google Slides for directions on how to use Canvas Chrome for virtual learners.
Part 2: Summarize Your Findings
- Students summarize their findings on the Student Sheet, Part 2.
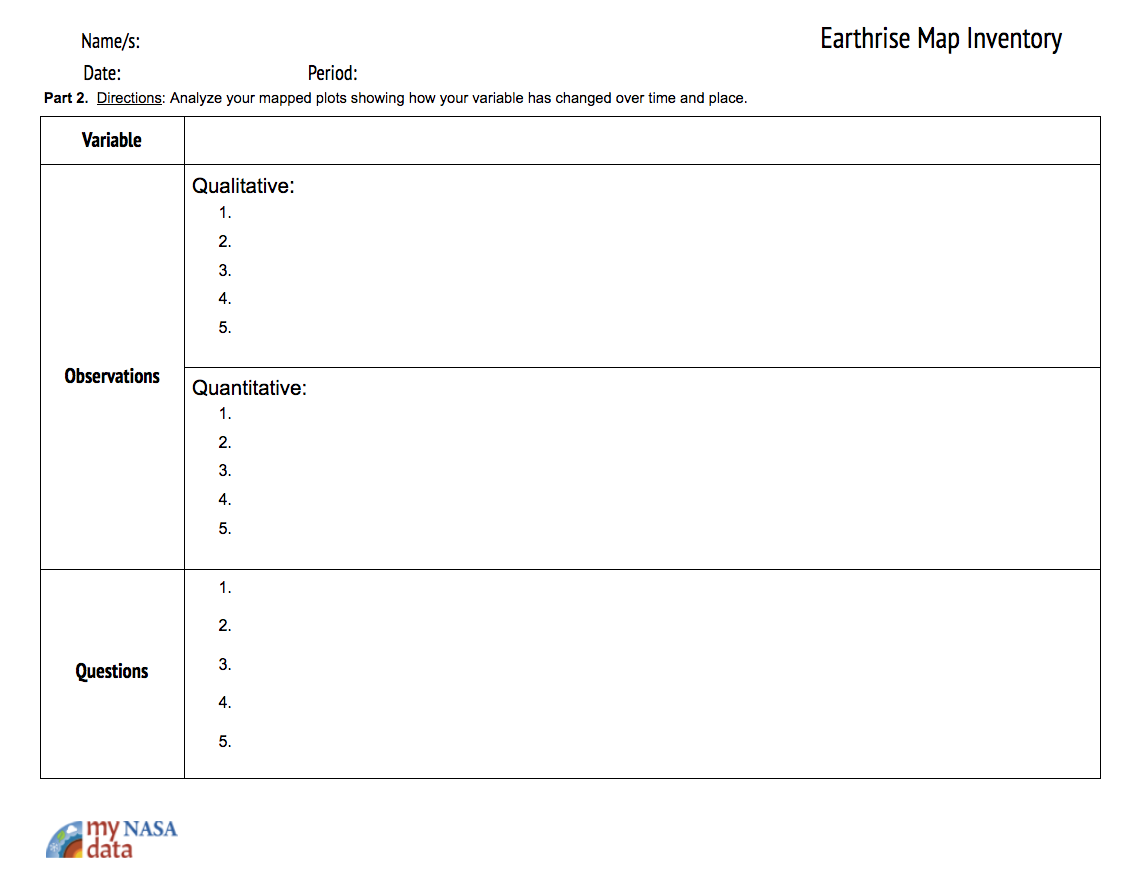
- Here, they document the variable being analyzed by identifying five qualitative and five quantitative observations. (Qualitative observations use your senses to observe the results; Quantitative observations are measurable and described using numbers and data; they can be collected with instruments such as rulers, balances, thermometers, etc.)
- Qualitative observation examples: How dark certain colors are, what the patterns look like, etc.
- Quantitative observation examples: How many regions are shaded each month, how many places have overlapping coloring, etc.
- Students also craft five researchable questions that come to mind in their analysis.
- Research question examples: What is causing the patterns that I observe?, How could patterns of other variables change the patterns I see?
- Here, they document the variable being analyzed by identifying five qualitative and five quantitative observations. (Qualitative observations use your senses to observe the results; Quantitative observations are measurable and described using numbers and data; they can be collected with instruments such as rulers, balances, thermometers, etc.)
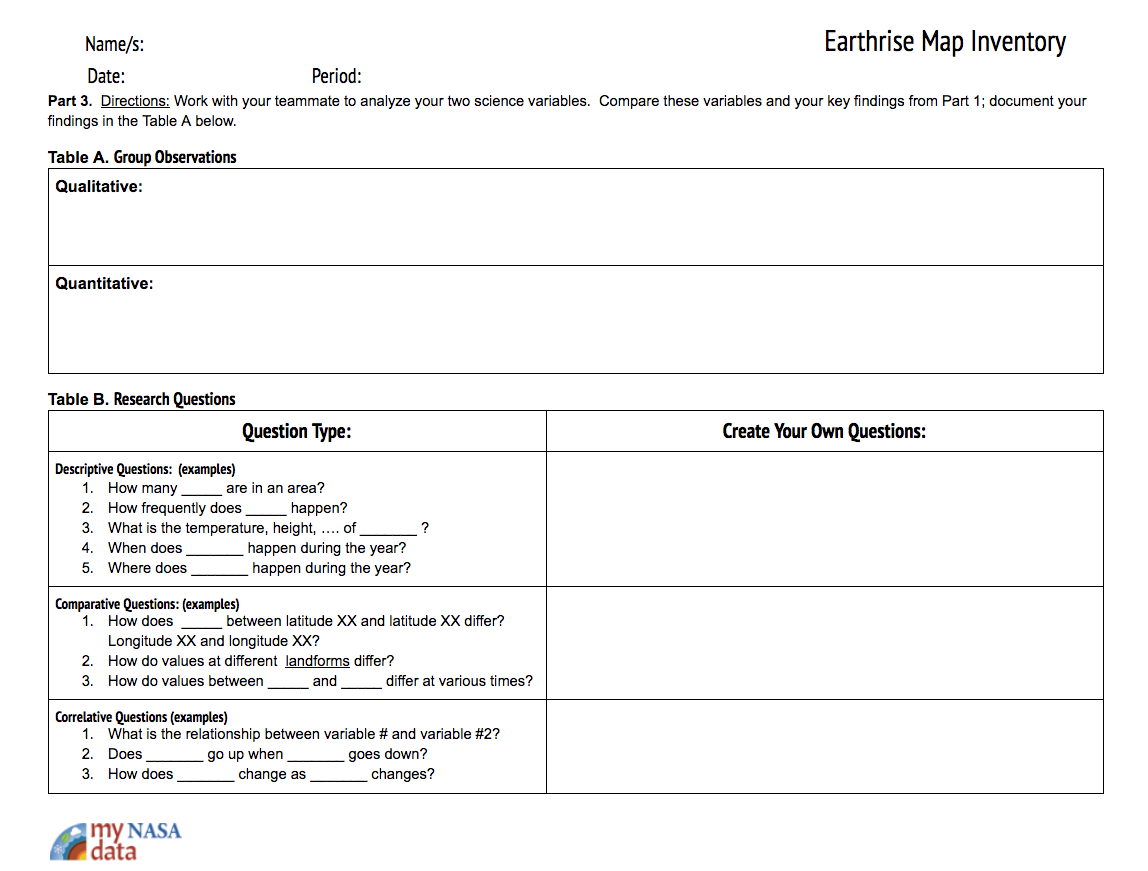
Part 3: Communicate Your Finding and Expand Your Research
- Distribute Part 3 of the Earthrise Map Inventory.
- Students team up with a student exploring a different variable.
- Together, they complete the two tables by analyzing the two science variables as they compare their observations. They document patterns or relationships found among the two in Table A.
- Explain to students the types of questions:
- Descriptive Questions: describe the variables you are measuring. (How many…?, How often…?, etc.)
- Comparative Questions: examine the differences between two or more groups on one or more dependent variables (What is the difference…?, How do ______ compare?, etc.)
- Correlative Questions: analyze the causal relationships, associations, trends and/or interactions amongst two or more variables on one or more groups (How does ____ change with ____?, What is the relationship of _____ to ________?, etc.)
In Table B., students work together to create their own questions using the three different types of questions: Descriptive, Comparative, and Correlative.
Part 4: Share your Research with a Gallery Walk
- Students share their findings through a gallery walk. This will help students view the patterns of other variables they did not study. The class should be able to have a clear view of each variable this way. Have nearly half of your students post their data sheets on the walls and disperse themselves around the room. An important factor is that the student works are spread far enough apart to reduce significant crowding.
- The other half will walk around and visit the displayed work while carrying a clipboard with their own data. They will share their own data through the process. Students should also discuss the questions they formulated in Parts 2 and 3.
- Post the following questions on the board or projector for the students to answer as they conduct their Gallery Walk. Students will be expected to present their answers at the end in an exit ticket.
- How does each of the different variables change over the year? (evaluate)
- Which variable seems to affect another variable? (apply)
- What processes connect them? How do you know? (understand)
Disciplinary Core Ideas:
- ESS2A: Earth Materials and Systems
Crosscutting Concepts:
- Systems and System Models
- Stability and Change
Science and Engineering Practices:
- Asking Questions and Defining Problems
- Developing and Using Models
- Analyzing and Interpreting Data
- Analyze the sequence of plots over time for different variables for changes
- Create visualization for showcasing key areas experiencing change over time
- Collaborate with peer to showcase changes and identify opportunities for future research
- Develop research questions
- How is the global system changing?
- What other parts of the Earth System change over time?
- Where do these changes tend to occur?
- What variables appear to be correlated?
The "Earthrise" photograph became one of the most famous photos from all of the Apollo missions and one of the most reproduced space photographs of all time. It has been credited for inspiring the beginning of the environmental movement as this view underscored the need to better understand and protect the Earth. In Life Magazine's 100 Photographs that Changed the World edition, wilderness photographer Galen Rowell called Earthrise, "the most influential environmental photograph ever taken."
NASA is, and will continue to be, in the forefront of researching our planet’s interconnected systems, from a global scale down to minute processes in the Earth System. NASA is focused on developing a scientific understanding of the Earth as a whole system and its response to natural or human-induced changes. NASA's research on the Earth focuses on the following five questions. Answering these questions is vital to understanding the Earth and protecting it for future generations.
- How is the global system changing?
- What are the primary forces of the Earth system?
- How does the Earth system respond to natural and human-induced changes?
- What are the consequences of change in the Earth system for human civilization?
- How well can we predict future changes in the Earth system?
The Earth is a system of interacting parts that work together to form our complex planet; it is made up of five major parts or subsystems: Atmosphere, Hydrosphere, Biosphere, Cryosphere, and Geosphere which are connected to each other in a complex web of processes.
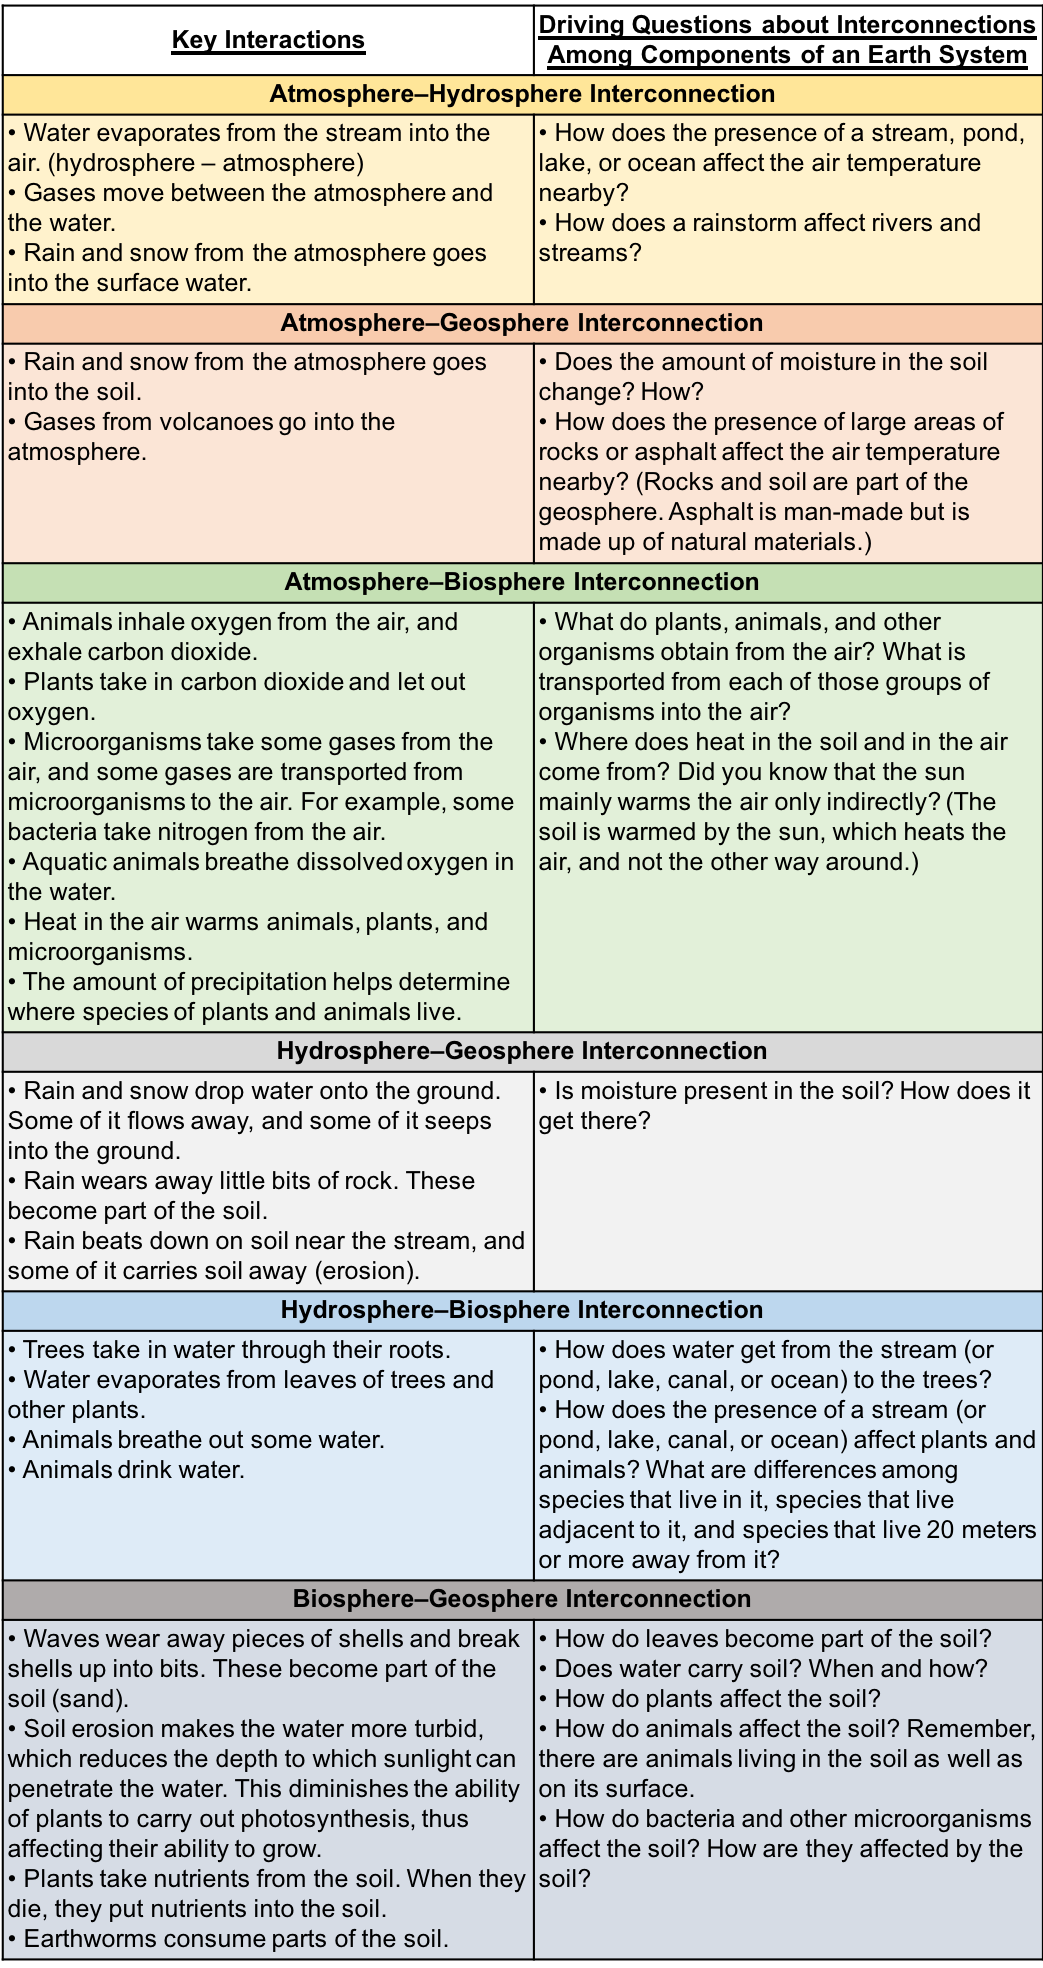
As students review the Earth System Satellite Images in their collaborative teams, help them to connect the different sphere interactions by highlighting the following interactions with the driving questions below to engage prior knowledge and activate learning.
For more information:
- GLOBE’s Connecting the Parts of the Earth System for more information on system interactions.
- NASA EO Kids: 60 Years of Looking at Earth from Above
- Blue Marble Matches Lesson Plan/Activity, Grade Levels: 3-12
- This 5-E lesson connects the shape of Earth's surface (and the names of the features that correspond to those shapes and textures) to the processes that form them. It also introduces students to how scientists use Earth to gain a better understanding of other planetary bodies in the solar system.
National Geography Standards:
- 8th Grade 7.1: The physical processes that shape the patterns of Earth's surface: The four components of Earth’s physical systems (the atmosphere, biosphere, hydrosphere, and lithosphere) are interdependent
- 12th Grade 7.1: The physical processes that shape the patterns of Earth's surface: The interactions of Earth's physical systems (the atmosphere, biosphere, hydrosphere, and lithosphere) vary across space and time.
On Christmas Eve, 1968, none of the astronauts aboard Apollo 8 were prepared for the spellbinding moment when they would first see their home planet rise from behind the desolate lunar horizon. The vision of Earth provided them the first spot of color as they floated in the blackness of space, orbiting the lunar surface. "Earthrise" is the name given to a photograph of the Earth taken by William Anders during lunar orbit.
- Geographic Information Systems Technicians - Provide guidance to scientists or others who use geographical information systems (GIS) databases.
- Geospatial Information Scientists and Technologists - Research or develop new geospatial technologies.
- Remote Sensing Scientists and Technologists - Research a variety of topics using remote sensing techniques.
- Remote Sensing Technicians - Assist researchers using remote sensing methods.
- Computer and Information Scientists – Conduct research in the field of computer and information science
- Cartographers and Photogrammetrists – Collect, analyze, and interpret geographic data in the creation of maps
Part 5: For Early Finishers
- With additional time, have students explore the Earth System Data Explorer (https://larc-mynasadata-2df7cce0.projects.earthengine.app/view/earth-sy…) to find answers to their questions identified in Part 2 and Part 3.
- Students should first review the YouTube tutorials available here, https://mynasadata.larc.nasa.gov/basic-page/tutorials
- Internet Required
- One-to-One (tablet, laptop, or CPU)
- One-to-a-Group
- Teacher computer/projector only
- Visualization Tool Required
- Advanced technical equipment/expertise required


Interactive Files
Grade Band
- 6-8
- 9-12
Time
- > 90 minutes
Visualization Tool
NGSS Three Dimensional Learning
- See drop-down menu at the bottom of the page
Related Resources
- NASA Earthrise in photos: Photograph #1: and #2
- Documentary - "Earthrise: What It's Like to Escape Our Planet" | Op-Docs
- NASA Earthrise in 4K (6:46 Minutes)
- NASA “The Spirit of Apollo” - A Celebration of the 50th Anniversary of the Apol…
- NASA Earth from Afar
- Earth System Data Explorer Tutorials
- Data Literacy Cube Guide
- Instructional Strategies for the Earth Science Classroom