Lesson Plans
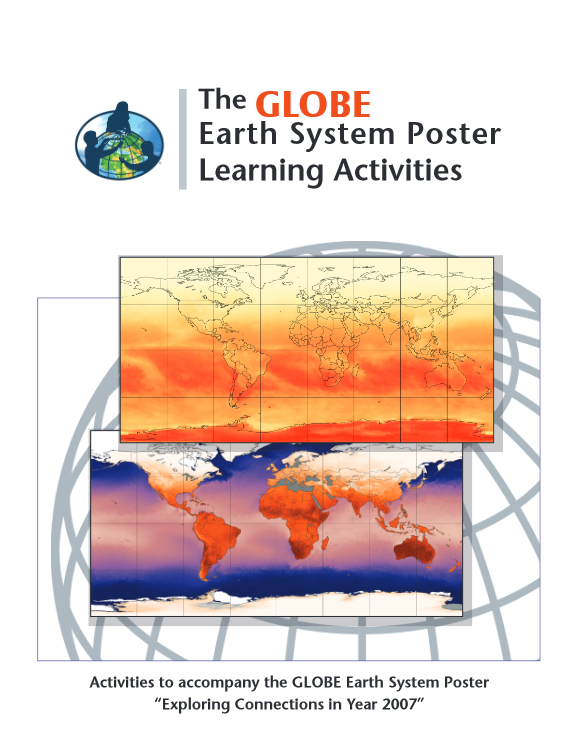
GLOBE Earth System Poster Activity Guide
Overview
The processes comprising the Earth’s environment are interconnected. Understanding how these connections operate on a global scale is to understand the Earth as a system. Developing this understanding about the Earth as a system requires a quantitative exploration of the connections among various parts of the system. These processes take place in and between the atmosphere, oceans, fresh water, ice, soil, and living components. These processes also include energy from the Sun, and the gases and particles that enter the atmosphere and oceans from both natural and anthropogenic, or human-caused, sources.
The activities in this guide will help students understand variations in environmental parameters by examining connections among different phenomena measured on local, regional and global scales. As students look at the connections between environmental data, they will see that the environment is the result of the interplay among many processes that take place on varying time and spatial scales. They will also understand that environmental processes are not bound by oceans, mountains, or country delineations–they are truly global in scope.
Materials Required
Printed color copies of the science variable/s of interest.
Procedure
This learning activity guide features five activities featuring the Earth System Poster Cards. You can view the activities from the Learning Activity book, as well as view the instructional videos.
- Exploring Single Images
- Exploring Annual Changes
- Exploring Relationships Between Two Variables
- Exploring Relationships Among Variables for a Particular Month
- Exploring Relationships Among Variables Six Months Apart
Disciplinary Core Ideas:
- ESS1C: The History of Planet Earth
Crosscutting Concepts:
- Patterns
- Systems and System Models
- Stability and Change
Science and Engineering Practices:
- Asking Questions and Defining Problems
- Developing and Using Models
- Planning and Carrying out Investigations
- Analyzing and Interpreting Data
- Constructing Explanations and Designing Solutions
- Engaging in Argument from Evidence
- Obtaining, Evaluating and Communicating Information
Students will be able to:
- Describe evidence of the Earth as a system
- Find patterns and connections between and among maps containing different environmental data
- Identify the relationship between time and space in regard to global environmental data
- Discover, analyze, and interpret patterns in a graphical display of data.
- Conduct an analysis of mapped data.
- Develop descriptions and explanations using evidence.
- Communicate observations and explanations.
Activity 1: Explore a single map
Focus Questions:
- What variable did you examine and what is the range of values shown on the scale bars?
- What interesting patterns did you observe for your focus region?
- Where in the world do you find the highest and lowest values (the extremes) of the data in your image? Why do you think these locations experience the extremes and not other locations?
- Are any patterns in the data noticeable? Are patterns different on different continents? Different over water than over land? Explain these patterns.
Activity 2: Exploring annual changes
Focus Questions:
- What changes do you see through the year? What explanations can you suggest for these patterns?
- Choose a location or region. During which months do the extreme highs and lows occur? What explanations can you suggest for the timing of those extremes?
- Which regions experience both the extreme highs and lows? which regions don’t experience the extremes? Why do you think this happens?
- What differences, if any, do you find between the year’s variations over the oceans versus the year’s variations over the continents?
- Are there regions that remain relatively unchanged over the year? Why do you think this happens?
Activity 3: Explore Relationships Between Two Variables
Focus Questions:
- What relationship do you see between the two variables?
- Do the relationships appear to be directly or inversely proportional? Explain.
Activity 4: Exploring relationships among variables for a particular month
Focus Questions:
- Which regions experience the extreme highs and lows for each variable?
- Which regions don’t experience the extremes? Why do you think this occurs?
- What differences, if any, do you find between variations of variables over the oceans versus variations in variables over the continents? What amounts of insolation, surface skin temperature, cloud fraction, precipitation and aerosols characterize the world’s most vegetated regions for a particular month? Where is the greatest concentration of aerosols originating from and how would you characterize that particular environment based on the six images?
Activity 5: Exploring relationships among variables six months apart
Focus Questions:
- Which variables change the most over the six-month period? Which variables change the least?
- Why do you think this happens?
- Do you see any relationships among the variables that you didn’t see previously?
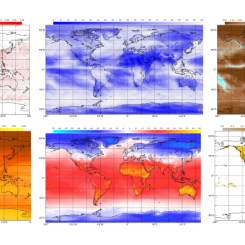
This digital GLOBE Earth system poster is provided by My NASA Data to extend the opportunities for learning. The digital poster provides data for additional years and also enables interactive exploration of the data in more detail. The Earth as a System images can be used with students to find patterns among different environmental data, understand the relationship among different environmental parameters, and understand how the data changes seasonally and over longer timescales.
The GLOBE website has individual images, activities, and the original Earth System posters that were developed for teachers to help students explore the concepts of Earth as a System, find patterns and connections between and among maps containing different environmental data, and to understand the relationship between time and space in regard to global environmental data.
- Insolation is the amount of incoming solar radiation (i.e., sunlight) reaching the Earth’s surface. These images are derived from measurements collected by the CERES instrument aboard, NASA’s Terra and Aqua satellites.
- The Surface Skin Temperature shown here is the surface skin temperature derived from CERES measurements. The surface skin temperature is the radiating temperature of the surface and has also been defined as the temperature 2 cm into the surface. Over Ocean, this surface skin temperature corresponds to the Reynold’s sea surface temperature.
- Cloud fraction is measured using MODIS aboard NASA’s Terra and Aqua satellites. Cloud fraction is the fraction of Earth’s surface covered by cloud.
- Total Rainfall is derived from the Global Precipitation Climatology Project (GPCP), which measures radar and microwave data that measure the vertical distribution of precipitation over the tropics in a latitude band between 35 degrees north and south.
- Aerosol Optical Thickness (AOT) is measured by MISR aboard NASA’s Terra satellite. AOT is a non-dimensional measure of the amount of particulate matter suspended in the atmosphere.
- The biosphere images are NDVI images MISR. Aboard NASA’s Terra satellite, MISR measures the NDVI (Normalized Difference Vegetation Index) using a comparison of visible and infrared wavelength emission.
- Standalone Lesson (no technology required)
Complementary Lesson Plans


Interactive Files
Grade Band
- 3-5
- 6-8
- 9-12
Time
- > 90 minutes
Visualization Tool
NGSS Three Dimensional Learning
- See drop-down menu at the bottom of the page