Lesson Plans
Earth System Satellite Images - Graph Points for a Location Over One Year
Overview
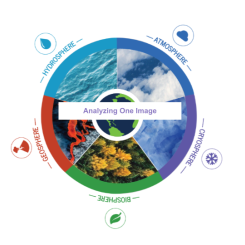
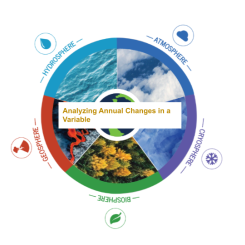
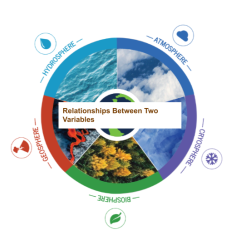
The Earth System Satellite Images available on My NASA Data provide teachers and students opportunities to explore data and identify relationships between/among different components of the Earth system. The Earth System Satellite Images, help the learner visualize how different Earth system variables change over time, establish cause and effect relationships for a specific variable, identify patterns, and determine relationships among variables.
In this lesson, students will graph six points for a location over one year.
This lesson has been adapted and modified from the GLOBE Earth System Poster Learning Activities.
Materials Required
- 2024 Earth System Satellite Images - Global slides or 2024 Earth System Satellite Images - Global PDF
- Pen, Pencil
NOTE: Consider laminating the resources in this list for future use.
Procedure
Teacher Preparation before the lesson:
Part I: Graphing Points for a Location
Part II. Close LessonAs an Exit Ticket:
|
Disciplinary Core Ideas:
- ESS2A: Earth Materials and Systems
- ESS2D: Weather and Climate
- ESS3C: Human Impacts on Earth Systems
Crosscutting Concepts:
- Patterns
- Cause and Effect
- Systems and System Models
Science and Engineering Practices:
- Developing and Using Models
- Analyzing and Interpreting Data
- Obtaining, Evaluating and Communicating Information
The learners will be able to:
- Discover, analyze, and interpret patterns in a graphic display of data
- Conduct an analysis of mapped data
- Develop descriptions and explanations using evidence
- Develop an understanding of the interactions within the Earth system
- Establish cause and effect relationships for a specific variable, identify patterns, and determine relationships between variables
- How can plotting points using a coordinate graph provide you with data pertaining to a specific location on a map?
The processes comprising the Earth’s environment are interconnected. Understanding how these connections operate on a global scale is to understand the Earth as a system. Understanding the Earth as a system requires a quantitative exploration of the connections among various parts of the system. These processes take place in and between the atmosphere, oceans, fresh water, ice, soil, and living components. These processes also include energy from the Sun, and the gases and particles that enter the atmosphere and oceans from both natural and anthropogenic, or human-caused, sources. The activities in this guide will help students understand variations in environmental parameters by examining connections among different phenomena measured on local, regional and global scales. As students look at the connections between environmental data, they will see that the environment is the result of the interplay among many processes that take place on varying time and spatial scales. They will also understand that environmental processes are not bound by oceans, mountains, or country delineations–they are truly global in scope.
Students need to be familiar with longitude and latitude, as well as familiarity with qualitative and quantitative observations.
Students need to be familiar with creating a time series graph.
| Studying how Earth’s systems interact is as important as studying the individual systems. NASA and its international partners operate several Earth-observing satellites, collectively called the A-Train, that closely follow one after another along the same orbital track. The near-simultaneous observations of a wide variety of factors help the scientific community advance our knowledge of Earth-system science and apply this knowledge for the benefit of society. Source: NASA 60 Years and Counting |
- Use the Earth System Satellite Images Graphic Organizer to explore and analyze the differences between the different variables.
- Create questions based on the variable(s) you wish the students to analyze. For example: Observe the locations on the map. What differences are observed within the same months, but different variables?
- Once the students have had time to complete their graphic organizers, you can moderate a discussion so that students can compare the differences and similarities among the variables.
- Standalone Lesson (no technology required)
- Internet Required
Complementary Lesson Plans


Interactive Files
Grade Band
- 3-5
- 6-8
- 9-12
Time
- 50 minutes
Visualization Tool
NGSS Three Dimensional Learning
- See drop-down menu at the bottom of the page