Lesson Plans
Hurricane Sandy to Scale
Overview
In this lesson, students use mathematics to form a basic model of the area covered by a hurricane. They evaluate the usefulness of the model for determining potential impacts on people and communities and use the model to look at the potential reach of a hurricane. Students use their knowledge of natural hazards to determine the limitations of the model.
Materials Required
Per Student:
- Hurricane Sandy to Scale Map
- Hurricane Sandy to Scale Student Sheets
Per Student Group:
- Drawing Compass
- Ruler (depending on the type of compass)
- Internet-enabled device (can be used by groups or as a class if needed)
Procedure
Before Class: Have device/s with internet access available.
Engage Prior Knowledge:
- Ask students if they have ever seen hurricane forecasts. Would they be concerned if a hurricane were approaching the area where they live? If they lived on the coast near, but not directly where a hurricane was forecast to make landfall would they make preparations?
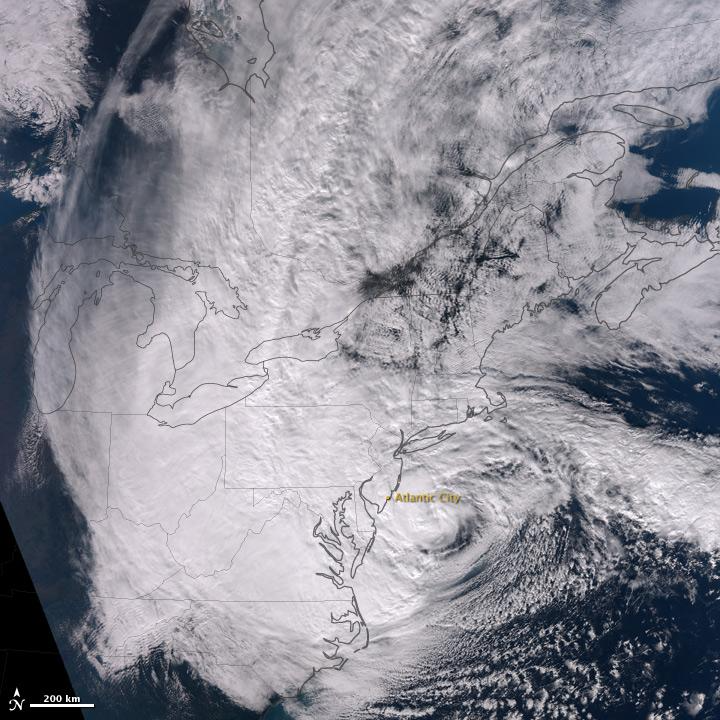
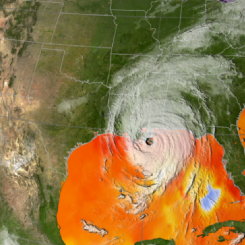
- Set the stage for learning by telling students that they will make a simple model of a hurricane to determine how far-reaching the effects of a storm can be. Explain that you will be using a real hurricane as an example, Hurricane Sandy, which made landfall on October 29, 2012.
- If needed, briefly review how and where a hurricane forms.
Research the Event:
- Distribute the Student Sheets to each student. Have students explore the information about Hurricane Sandy using the link provided and have them answer the questions.
- Review the questions with the students. Address any background information as needed, especially formulas for finding the area of a circle, circumference, etc.
Analyze the Data:
- Provide time for students to work alone or in small groups to answer the questions.
- The diameter of Hurricane Sandy was approximately 1600 km. What was the radius?
- What was the area? This is the area that was affected by strong winds of at least tropical-storm strength.
- Estimate the circumference of the hurricane.
-
Calculate the circumference if it were a perfect circle.
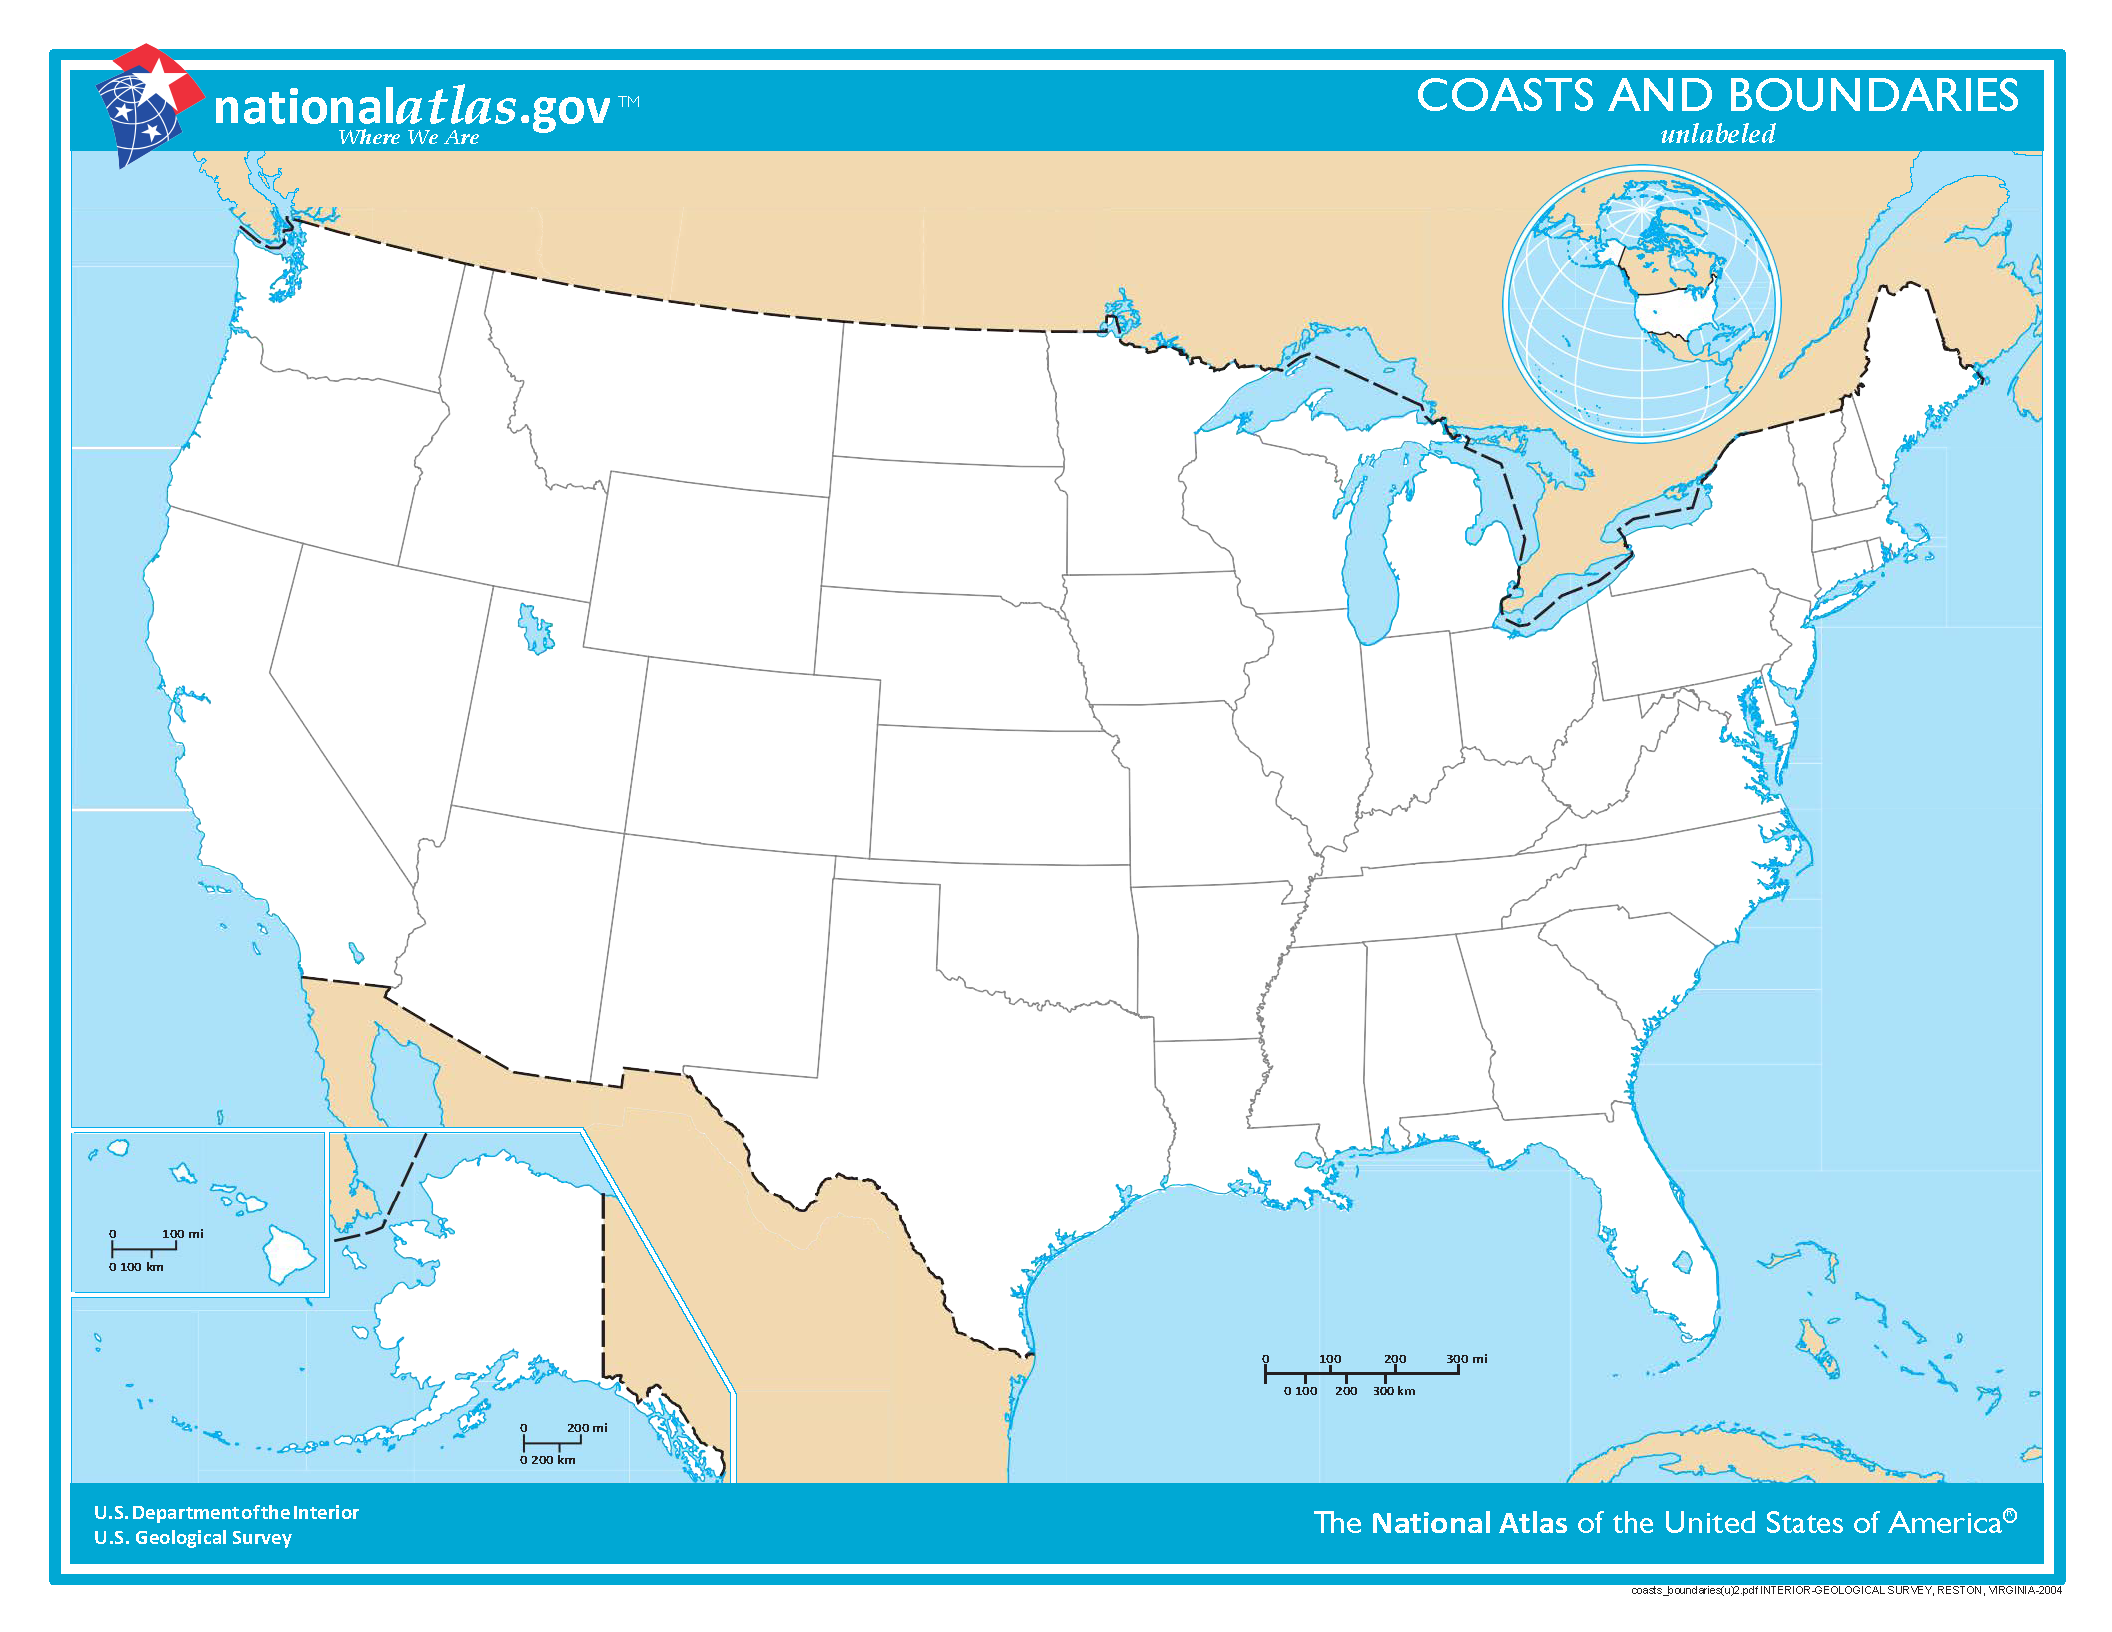
Credit: USGS's National Atlas

Create a Model Using Computational Thinking:
- Draw a circle to scale centered on Kansas on the US map provided. Use the radius you calculated from Hurricane Sandy.
- Is Kansas likely to be affected by a hurricane? Explain.
- Redraw the circle with the center over New Jersey.
Evaluate the Event Using the Model:
- Look at the image provided to compare the area covered. How many states would be affected?
- What states were actually affected?
- What does this mean for people who may not be directly where the eye of the hurricane hits, but are within the area of the storm?
- What effects would you expect people and communities to experience from the hurricane?
Communicate Your Conclusion:
-
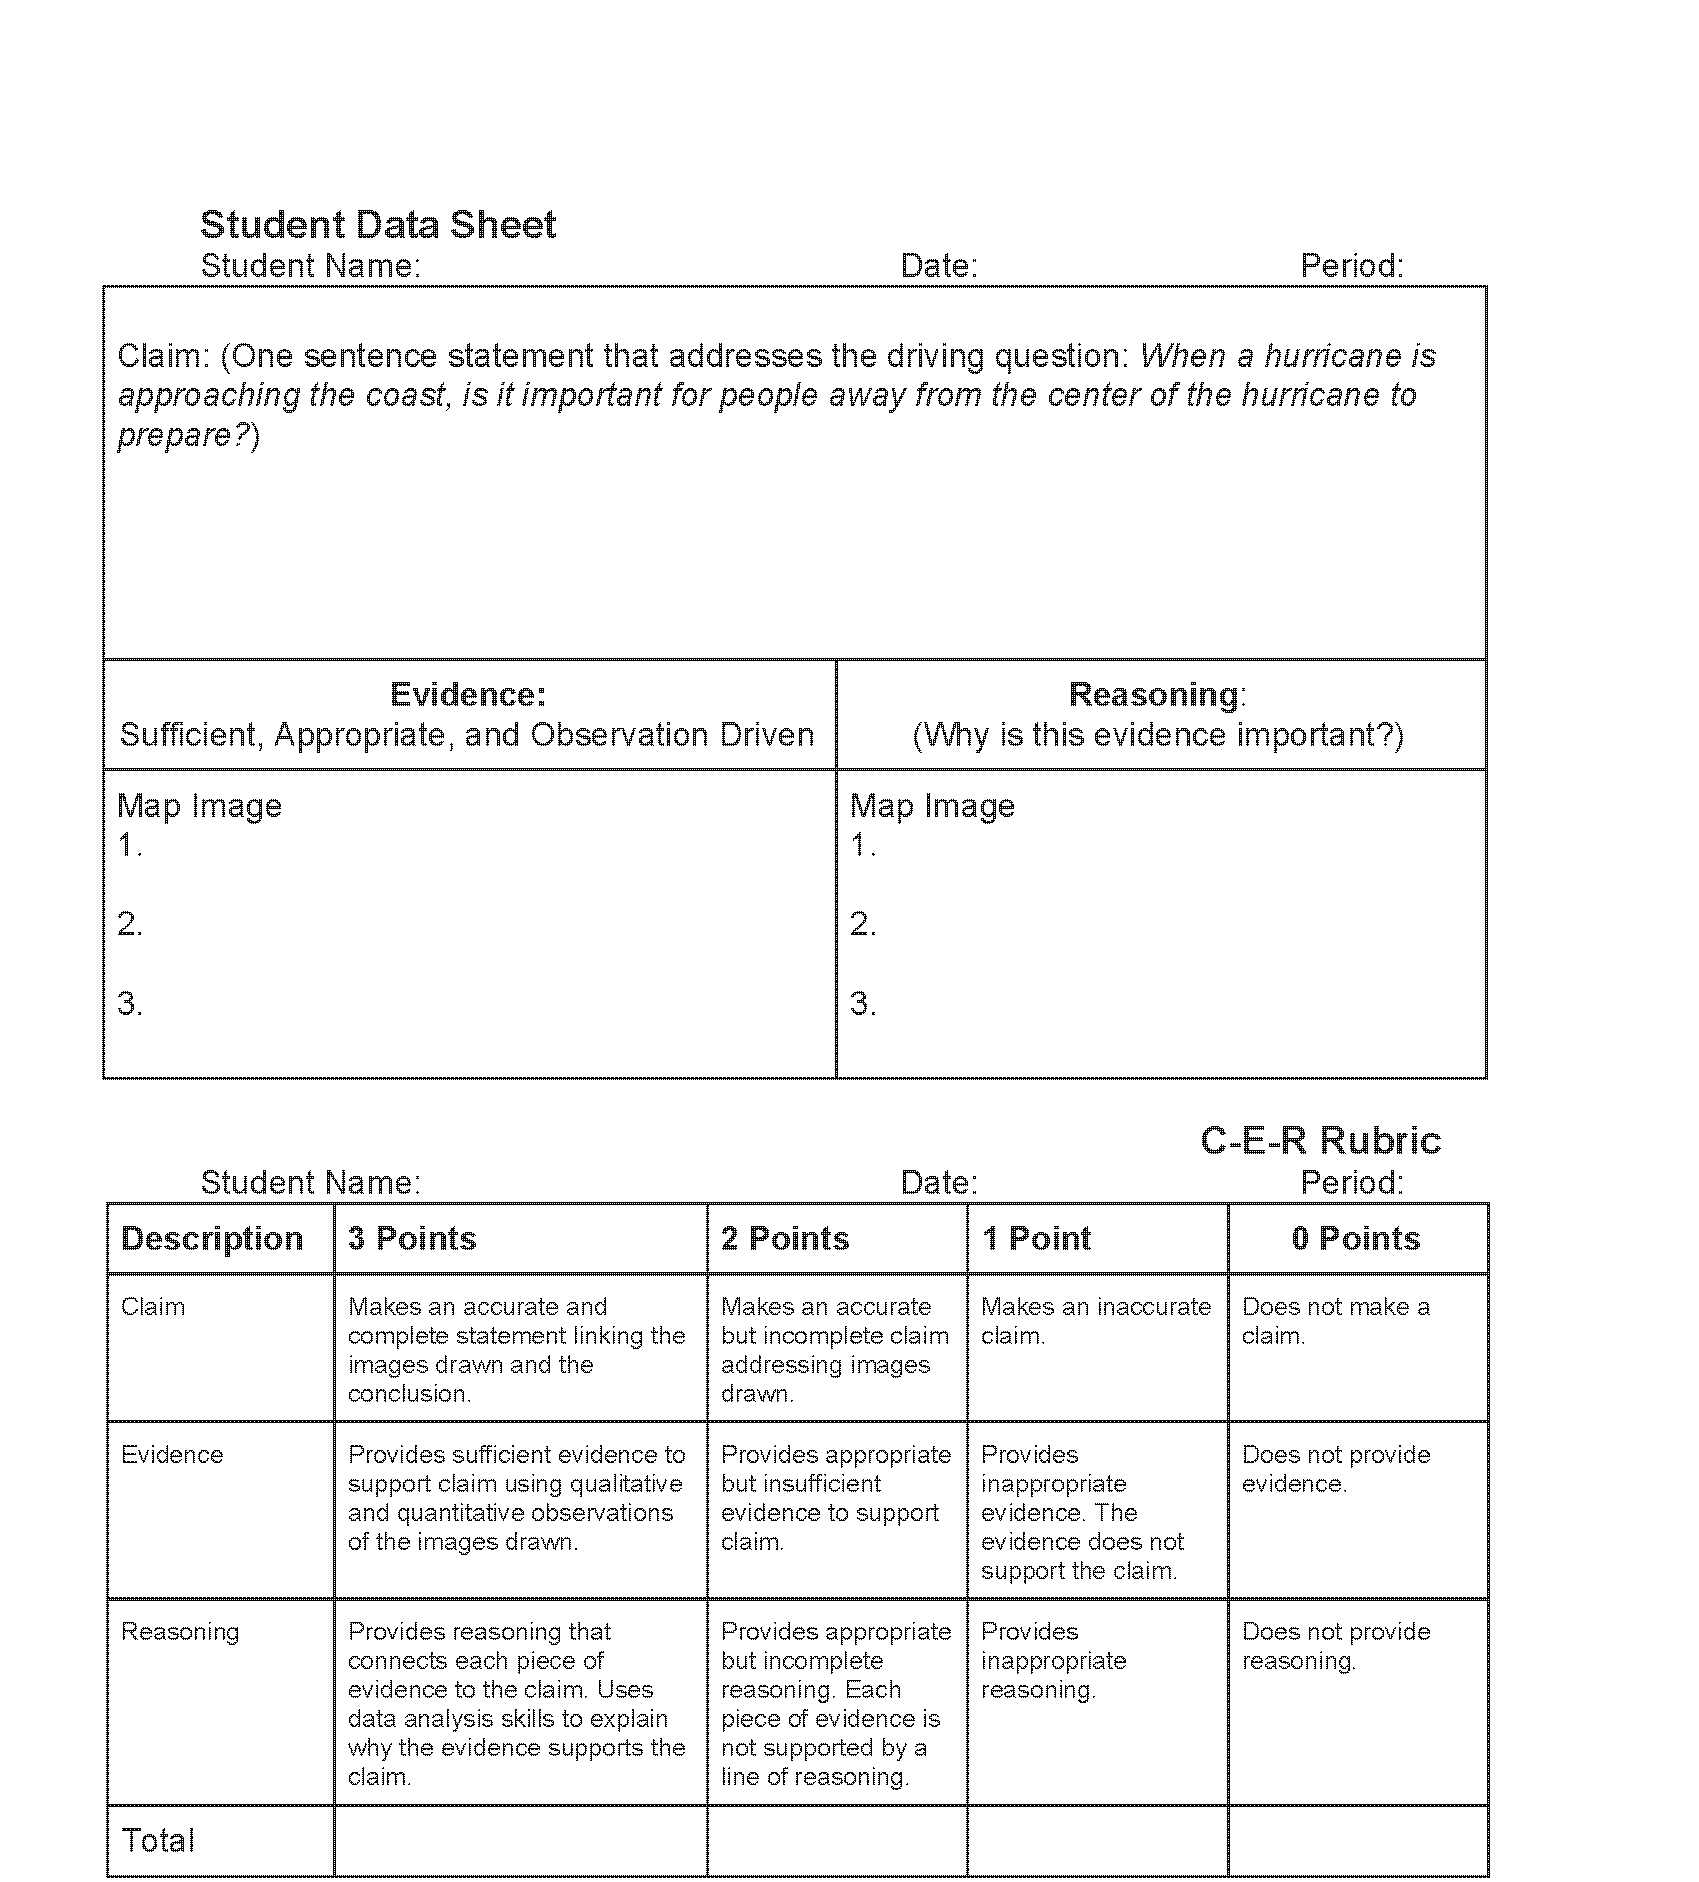
Use the Claim, Evidence Reasoning technique to answer the question: “When a hurricane is approaching the coast, why is it important for people away from the center of the hurricane to prepare?”
Answer Key:
Teachers who are interested in receiving the answer key, please complete the Teacher Key Request and Verification Form. We verify that requestors are teachers prior to sending access to the answer keys as we’ve had many students try to pass as teachers to gain access.
Disciplinary Core Ideas:
- ESS3B: Natural Hazards
Crosscutting Concepts:
- Scale, Proportion, and Quantity
Science and Engineering Practices:
- Developing and Using Models
- Using Mathematics and Computational Thinking
- Use mathematics to form a model of the area affected by Hurricane Sandy
- Evaluate the model for determining impacts to coastal communities
- Assess the limitations of the model
- What are the effects of hurricanes on our communities?
- How can we use models to understand severe storms?
- How can we use math to characterize hurricanes?
Driving Question
When a hurricane is approaching the coast, why is it important for people away from the center of the hurricane to prepare?
Circles are characterized using the constant pi, π, and the radius of the circle, r. The radius is the distance from the center of the circle to any point on the circle. In addition, the diameter of the circle, d, is the straight distance from a point on the circle through the center to the point opposite the first point.
These can be used to calculate the area, A, of a circle and the circumference, or distance around the circle, C, using the following formulas.
A = πr2
C = 2πr or C = πd
Hurricanes are large, swirling storms with winds of 119 kilometers per hour (74 mph) or higher. That's quicker than a cheetah can run which is the fastest animal on land.
Hurricanes are said to be the most violent storms on Earth. These storms are also called by other names, such as typhoons or cyclones, depending on where they occur. The scientific term for these storms is “tropical cyclone.” Only tropical cyclones that form over the Atlantic Ocean or eastern Pacific Ocean are called "hurricanes”. Whatever they are called, tropical cyclones all form the same way. (see https://pmm.nasa.gov/education/articles/how-do-hurricanes-form)
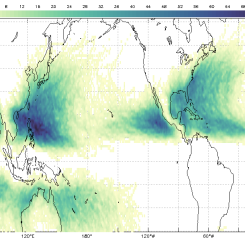
Because tropical cyclones are like giant engines that use warm, moist air as fuel, they form only over warm ocean waters near the equator. The number of hurricanes occurring each year varies widely from ocean to ocean, depending on how much warm ocean water exists. The most active area is the northwestern Pacific Ocean, which contains a wide expanse of warm ocean water. On average, twenty six tropical cyclones form in this region each year, of which seventeen reach hurricane (typhoon) status. In contrast, the Atlantic Ocean averages about ten storms annually, of which six reach hurricane status. Compared to the Pacific Ocean, the Atlantic is a much smaller area, and therefore supports a smaller expanse of warm ocean water to fuel storms. The Pacific waters also tend to be warmer, and the layer of warm surface waters tends to be deeper than in the Atlantic. Overall, about 80 tropical cyclones occur annually across the globe, one-third of which achieve hurricane status.The frequency and intensity of hurricanes varies significantly from year to year, and scientists haven’t yet figured out all the reasons for the variability. (see https://earthobservatory.nasa.gov/Features/Hurricanes/hurricanes_3.php)
Tropical cyclones usually weaken when they hit land, because they are no longer being "fed" by the energy from the warm ocean waters. (see https://pmm.nasa.gov/education/articles/how-do-hurricanes-form)
- It is assumed that students have been introduced to circles and the use of a compass to draw circles.
- Students should also have a working knowledge of the geography of the location of the fifty states in the United States of America or use a labeled map to guide them.
Students may think that only the center of a tropical cyclone, or hurricane, is dangerous. Examining the extent of a storm will support the idea that there can be a large area of serious impact from these storms.
How Does NASA Study Hurricanes?
Hurricanes are the most powerful weather event on Earth. NASA’s expertise in space and scientific exploration contributes to essential services provided to the American people by other federal agencies, such as hurricane weather forecasting.
NASA's Research Role
NASA’s role as a research agency is to bring new types of observational capabilities and analytical tools to learn about the fundamental processes that drive hurricanes and work to help incorporate that data into forecasts. NASA collaborates with its interagency partners so that the nation benefits from our respective capabilities.
“Before we had satellites and aircraft, hurricanes would destroy entire cities, like the Labor Day Hurricane in Key West back in 1935,” said Gail Skofronick-Jackson, the project scientist for NASA’s Global Precipitation Measurement mission at NASA's Goddard Space Flight Center in Greenbelt, Maryland. “You would have no idea if a hurricane was coming until it was too late.”
NASA uses an arsenal of instruments to learn more about how these storms progress as they form. These devices orbit Earth on a fleet of spacecraft, including Aqua, Terra, the Global Precipitation Measurement core observatory, NASA-NOAA's Suomi NPP satellite, Calipso, Jason-2 and CloudSat.
- General Scientist - A scientist is a person that works in a specific field to acquire or uncover knowledge related to the natural world.
- Meteorologist – as defined by the American Meteorological Society - a person with “specialized education who uses scientific principles to explain, understand, observe, or forecast the earth's atmospheric phenomena and/or how the atmosphere affects the earth and life on the planet.”
- Reporters and Correspondents - Report and write stories for news media.
- Have students research another hurricane and its effects.
- Have students develop an explanation of NASA's role in Hurricane Research.
- Have students research the sizes of other hurricanes and draw them on the map for comparison.
Sources:
- NASA Earth Observatory Image - Hurricane Sandy
- U.S. Department of the Interior/U.S. Geological Survey Map
- https://pmm.nasa.gov/education/articles/how-do-hurricanes-form
- https://earthobservatory.nasa.gov/Features/Hurricanes/hurricanes_3.php
- https://pmm.nasa.gov/education/articles/how-do-hurricanes-form
- Internet Required
- One-to-a-Group
Complementary Lesson Plans
Complementary Mini Lessons

Complementary Interactives

Grade Band
- 6-8
Time
- 50 minutes
Visualization Tool
NGSS Three Dimensional Learning
- See drop-down menu at the bottom of the page