Lesson Plans
Tropical Cyclone Counts - Compare Data Displays
Overview
The purpose of this lesson is for students to compare data displays to determine which best answers the driving question. To do this they will evaluate the spread of the data and what the displays show.
Materials Required
- Histograms, Box Plots and Scatter Plots (student produced or copies of the versions provided)
- Student Question Sheets
- Graph Choice Chart
Procedure
Assess Prior Knowledge of Data Displays
-
Group students to work on graphic models. Each group should have at least 3 students.
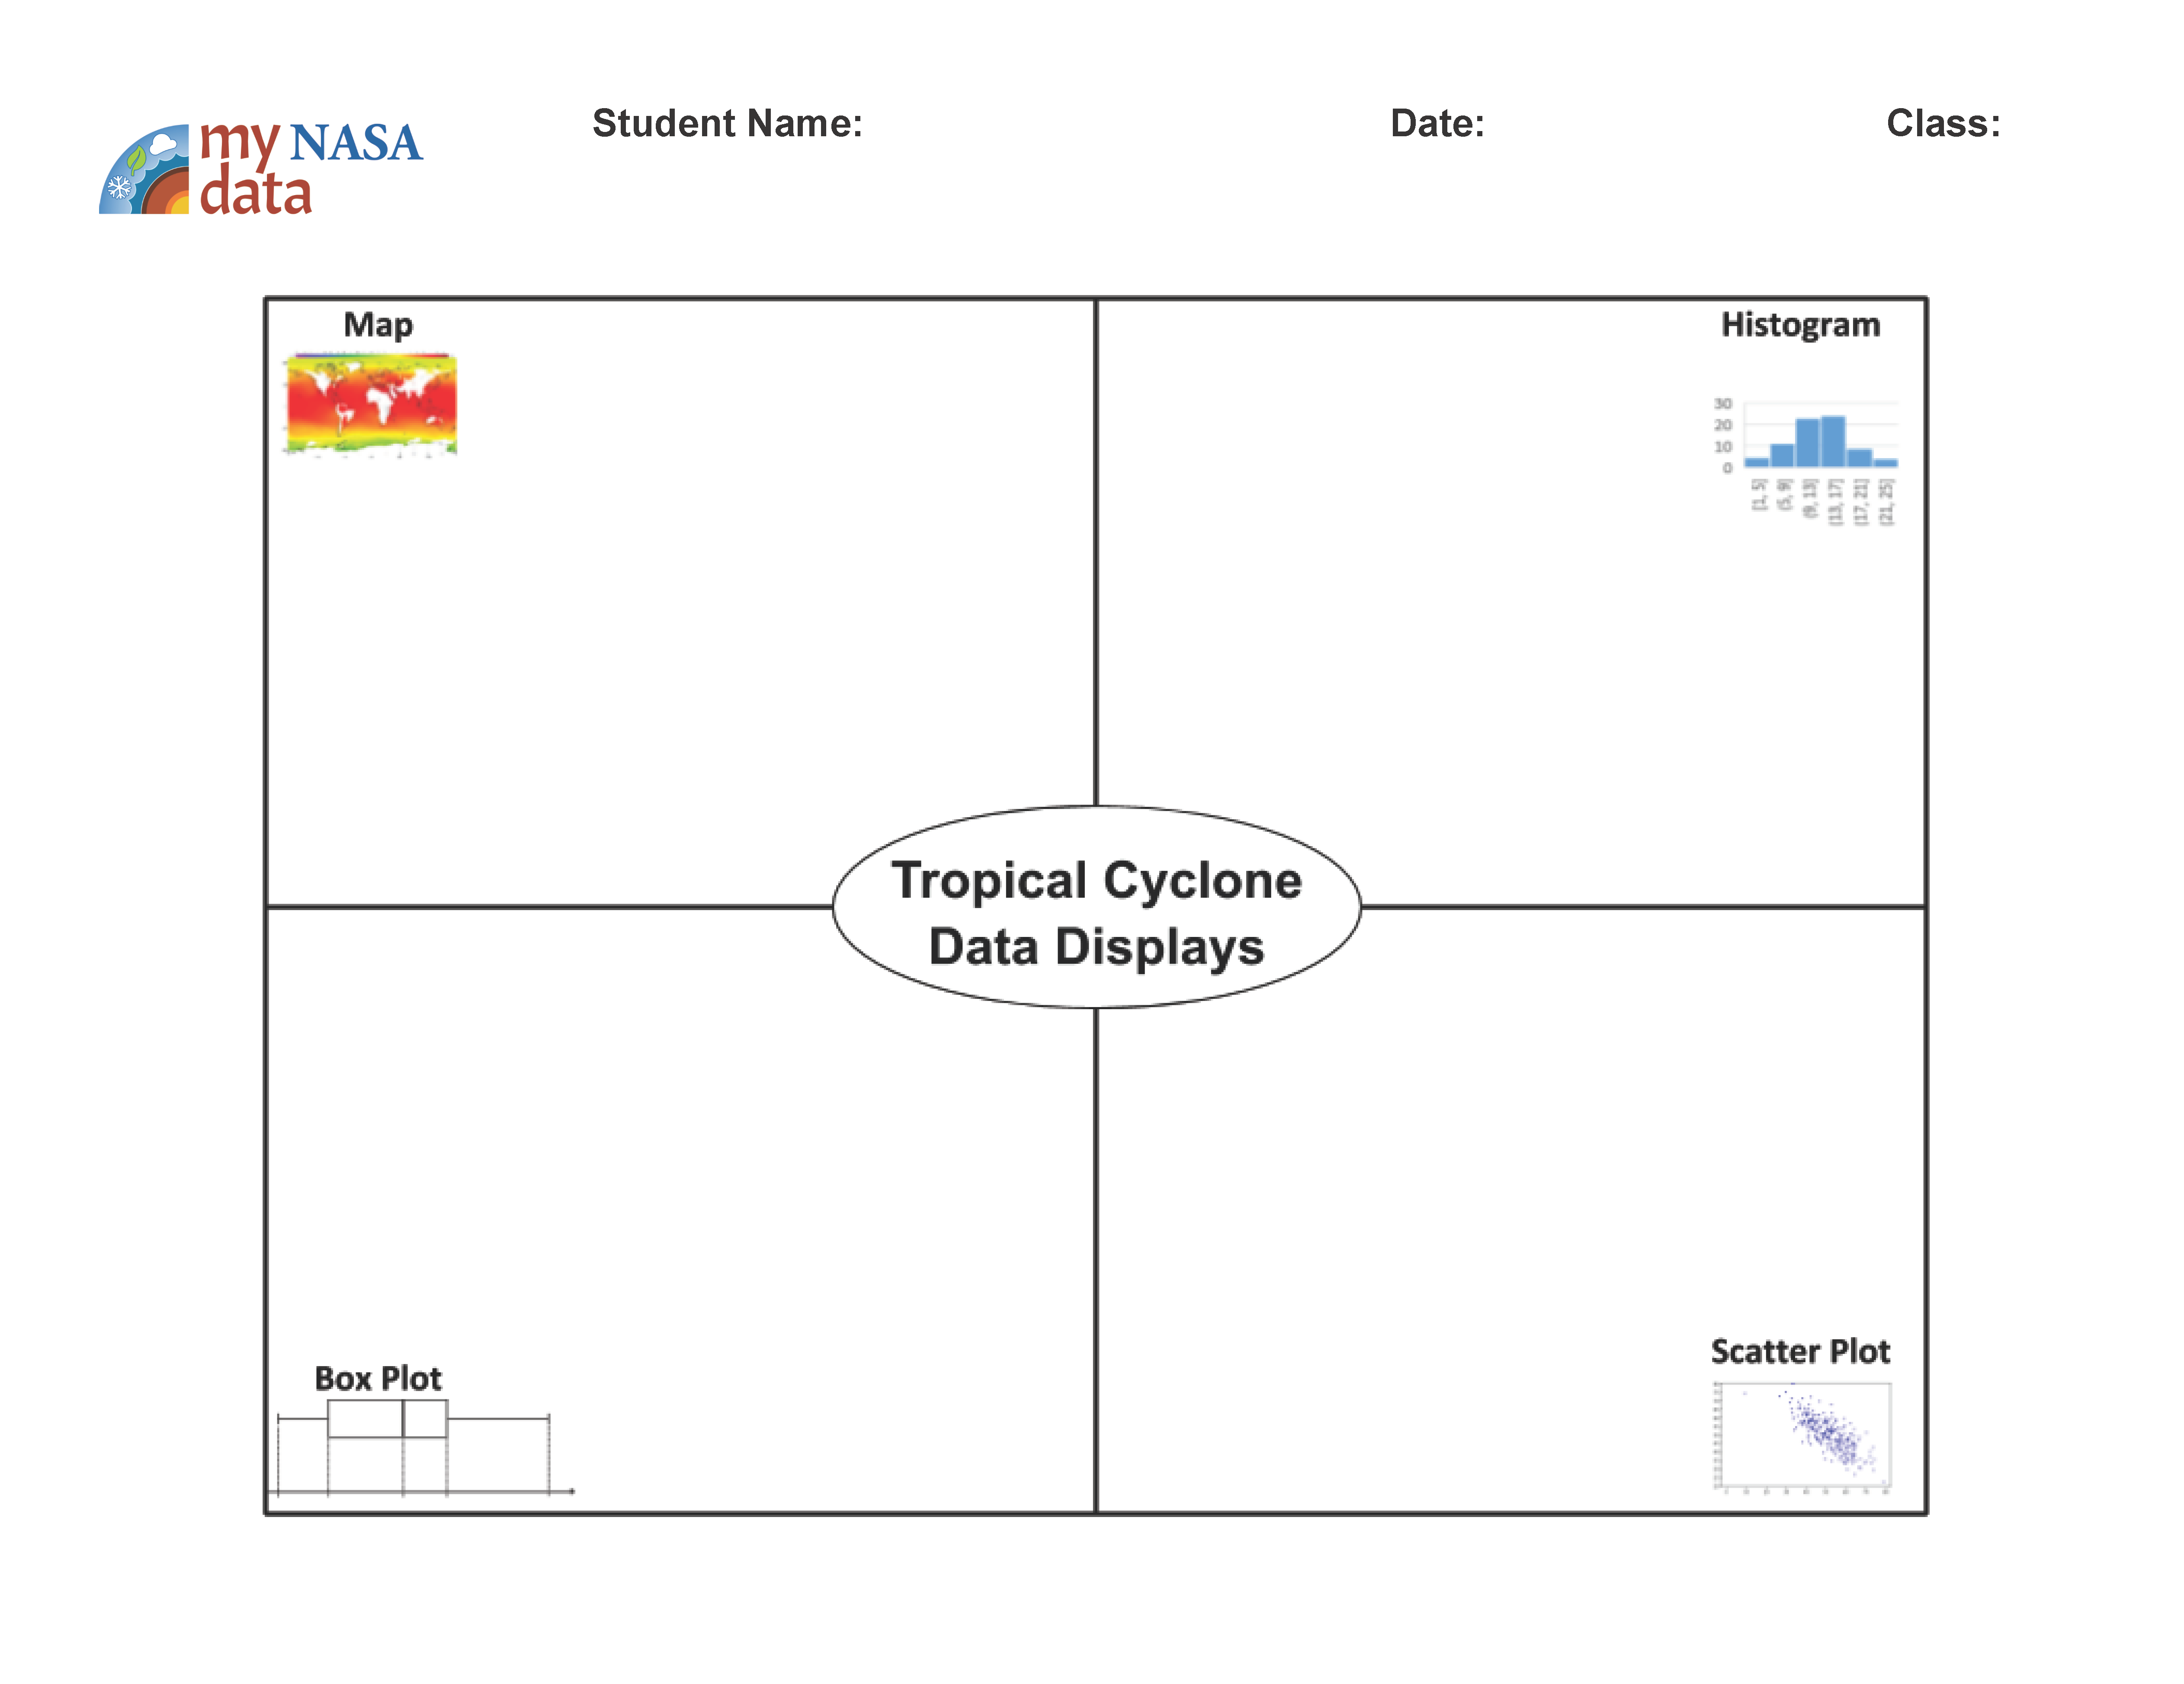
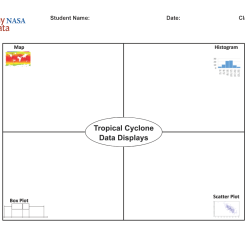
- Each group should write the types of questions that a histogram, box plot and scatter plot can answer in the corresponding boxes of the Tropical Cyclone Data Displays graphic organizer.
- The Graph Choice Chart can be used as a reference.
- Each group should also generate a question about tropical cyclones for each type of data display.
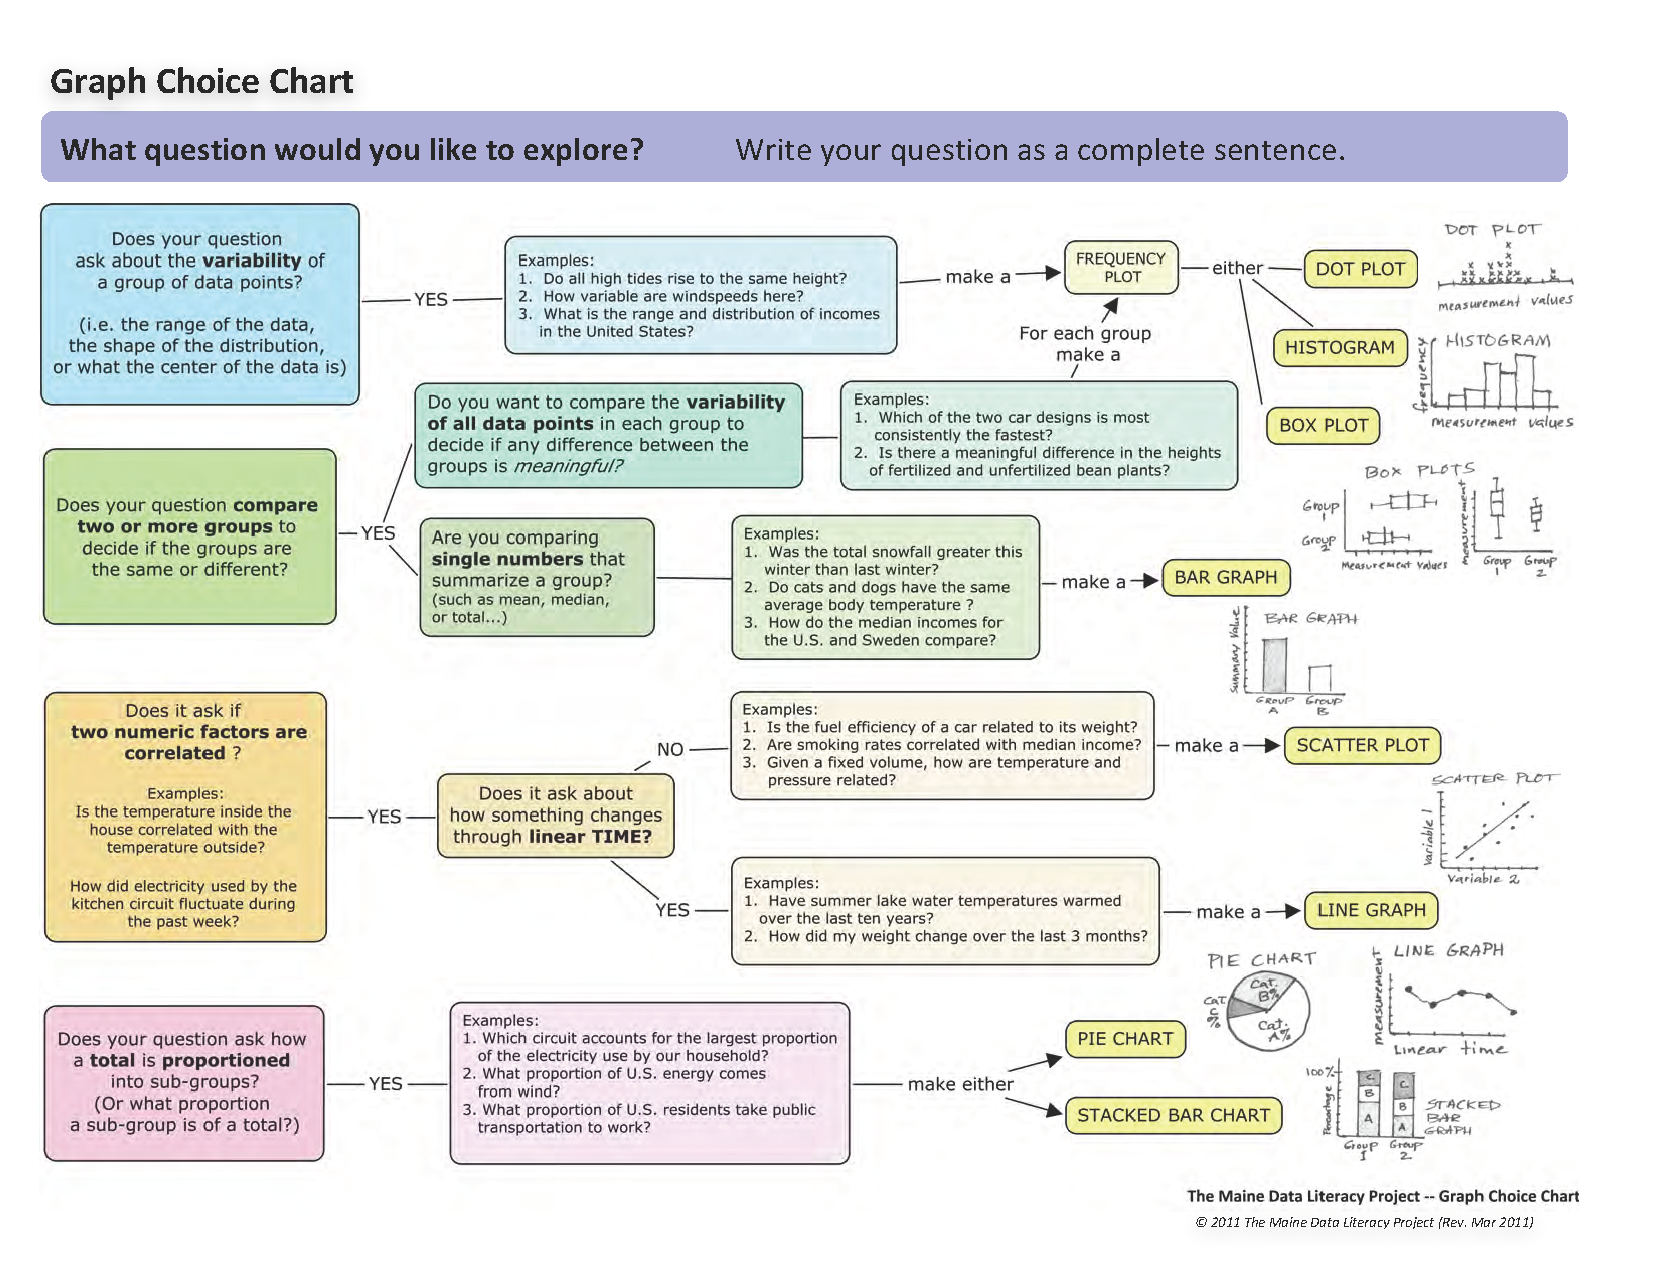
The Graph Choice Chart by The Maine Data Literacy Project*,
based on a work at participatoryscience.org
* Licensed under a Creative Commons Attribution-ShareAlike 4.0 International License.
Analyze Data
- Jigsaw – Each group has a different type of plot.
- Re-group students from graphic model groups by data display: histogram, box plot, or scatter plot.
- Give each group copies of one of the three types of plots.
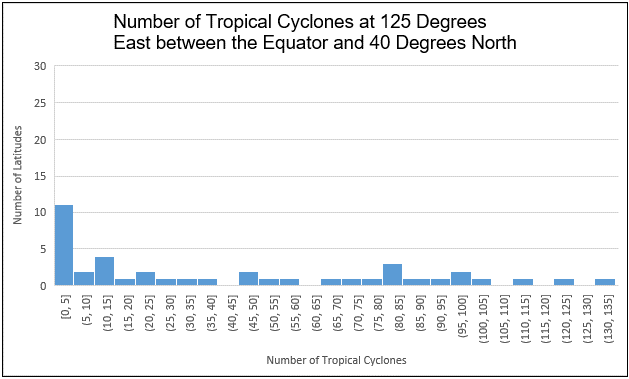
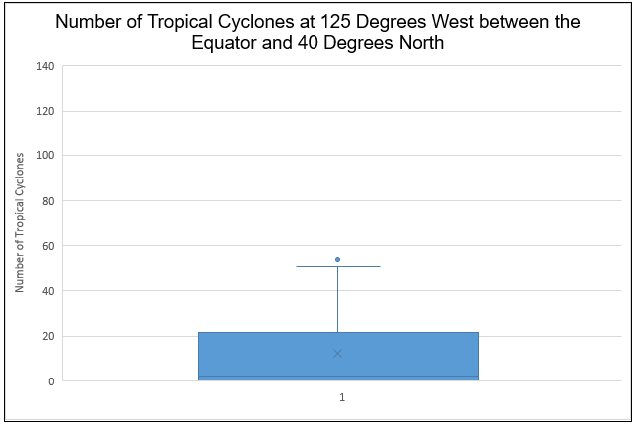
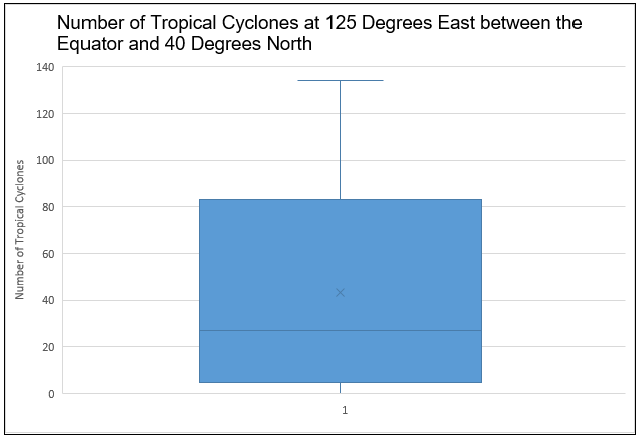
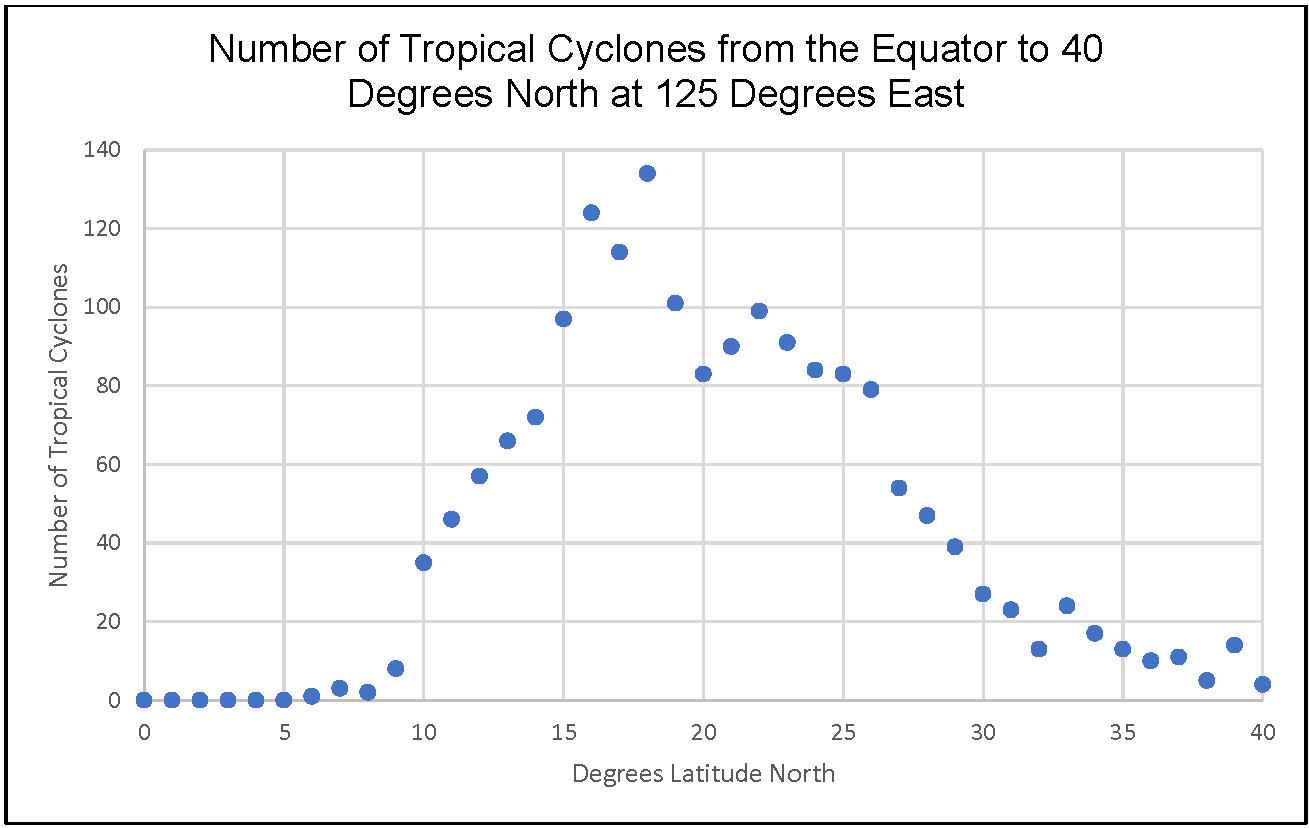
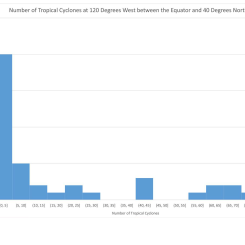
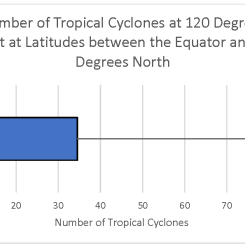
- There are two versions of each plot, one for 125 degrees east, and one for 125 degrees west.
- This will help them identify patterns.
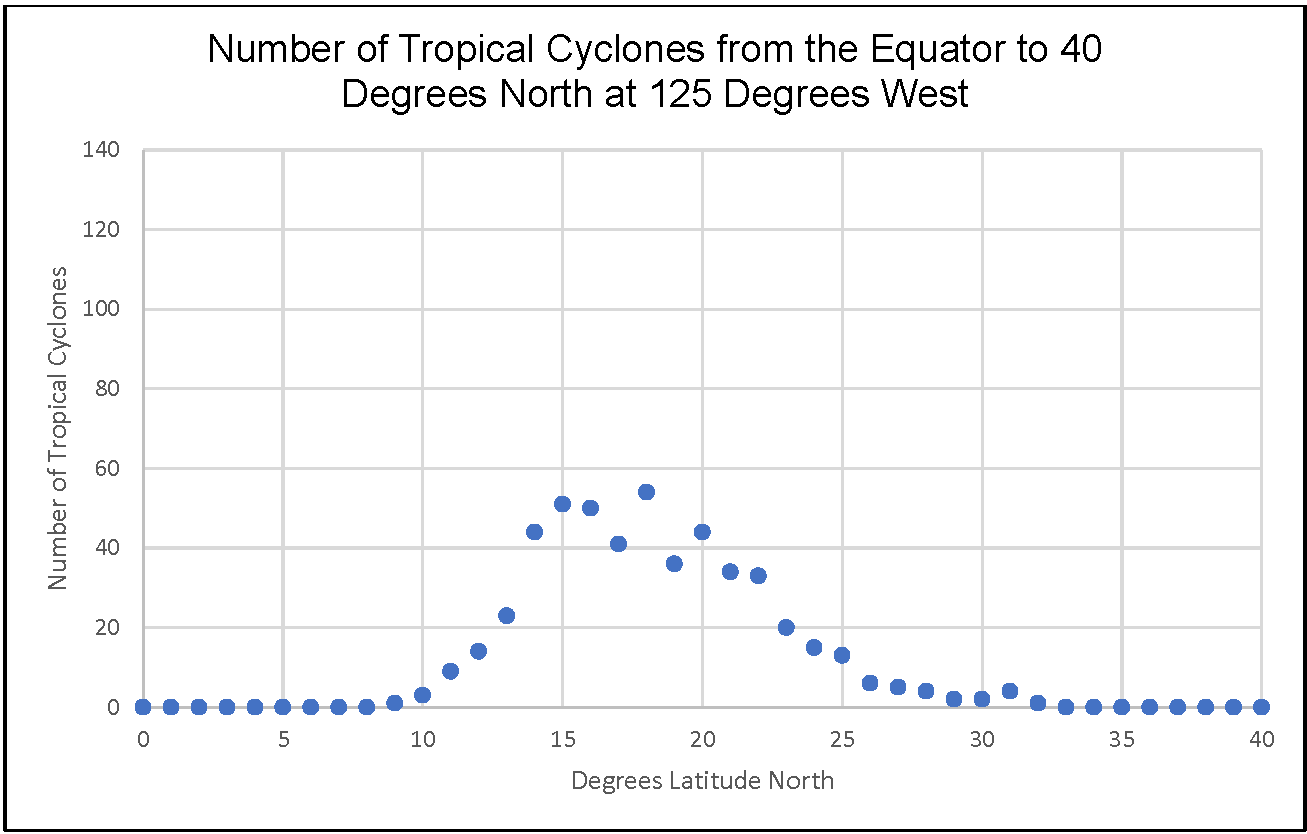
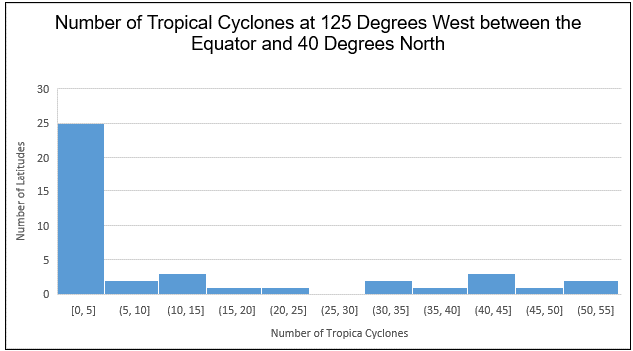
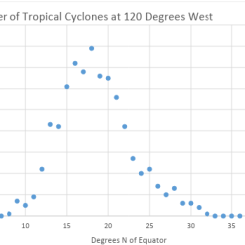
- Each group should analyze their plot to determine the information it provides regarding tropical cyclone counts at different latitudes for the longitudes used.
- Have students look for information like minimum, maximum, median, mode, correlation, distribution, patterns in data.
- There is a table in the student sheets that they can complete.
- Each plot will not provide the same information.
Data Displays
Summarize
- Students go back to their original graphic Model Groups to discuss patterns by latitude for all plot types.
- Students will share what they determined for their plot type with the group.
- Have the students answer the following questions for each plot type.
- What does the plot show?
- What patterns do you see?
- Does the plot answer any of the questions your group asked in their graphic model for that type of graph?
-
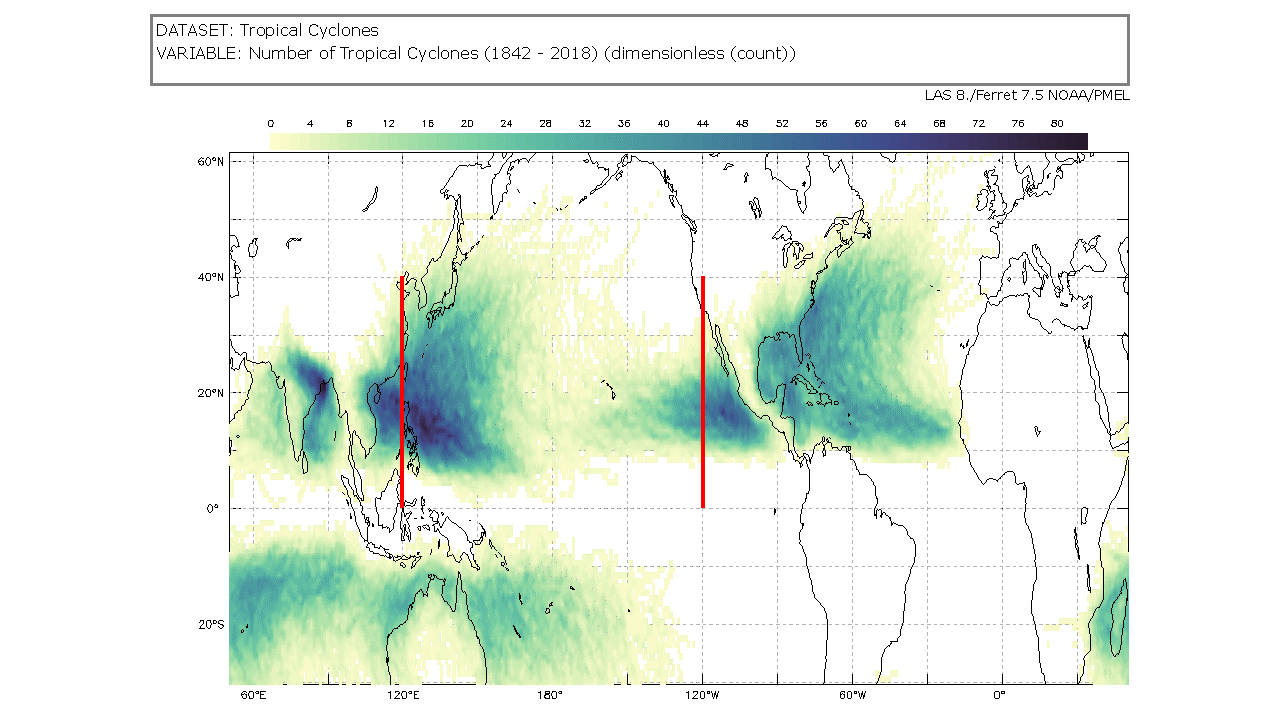
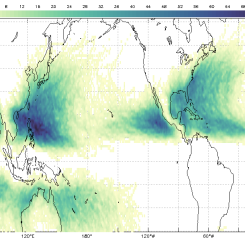
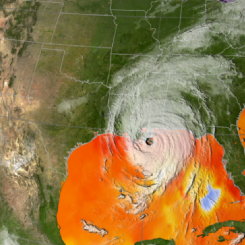
Students will discuss the map image and compare it with the other three plot types.
- Which type of graph is most useful for determining the latitudes with the highest and lowest tropical cyclone risk?
- What can you conclude about the distribution of tropical cyclones?
Assessment
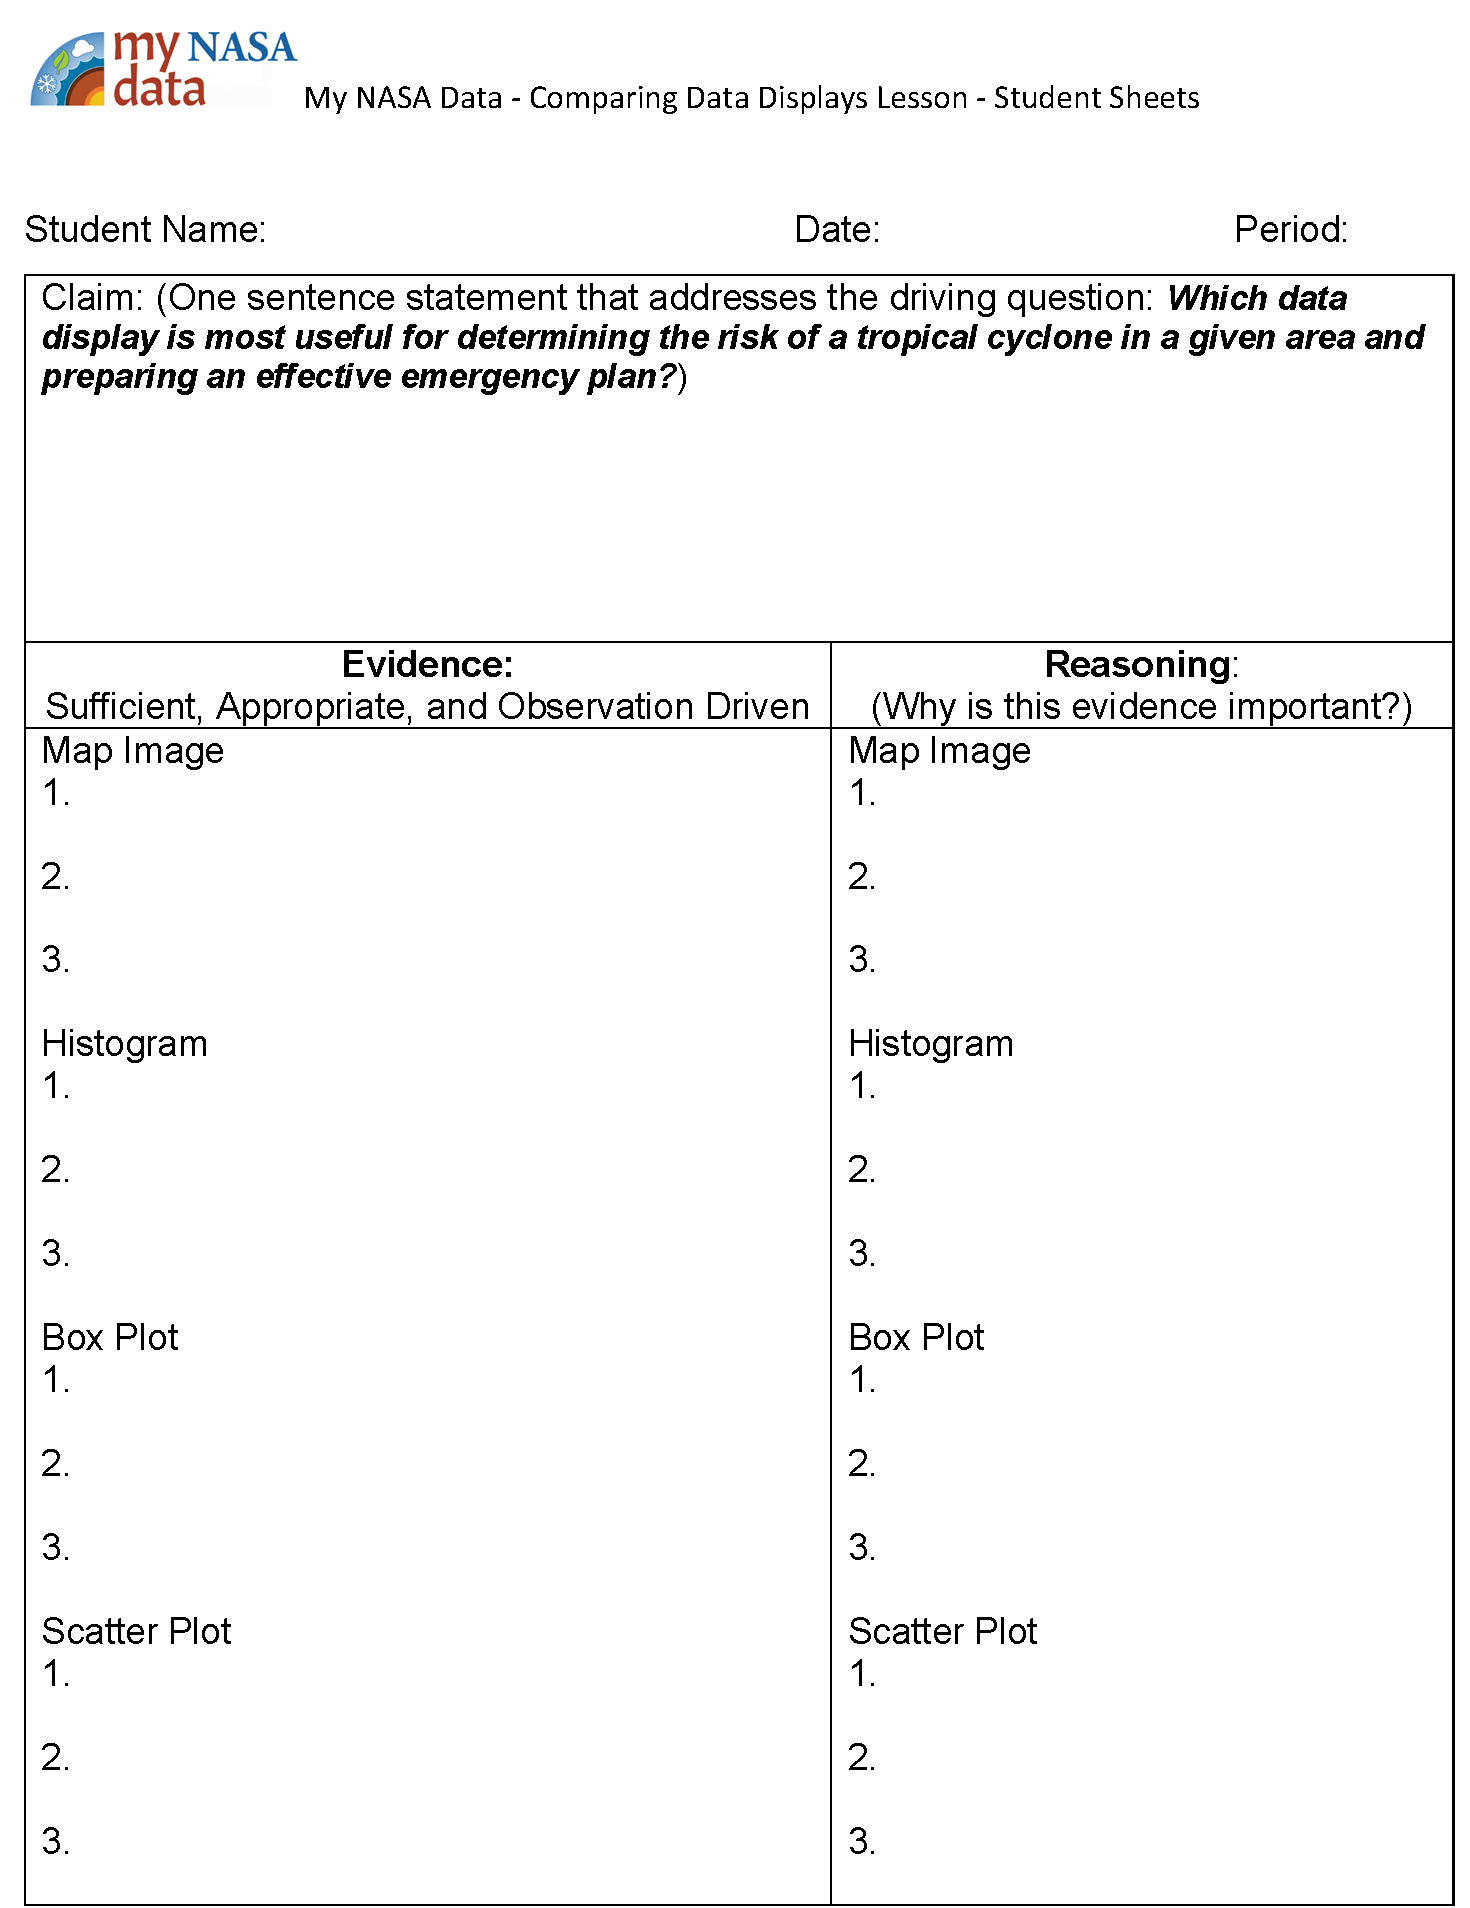
- Revisit the driving question: Which data display is most useful for determining the risk of a tropical cyclone in a given area and preparing an effective emergency plan?
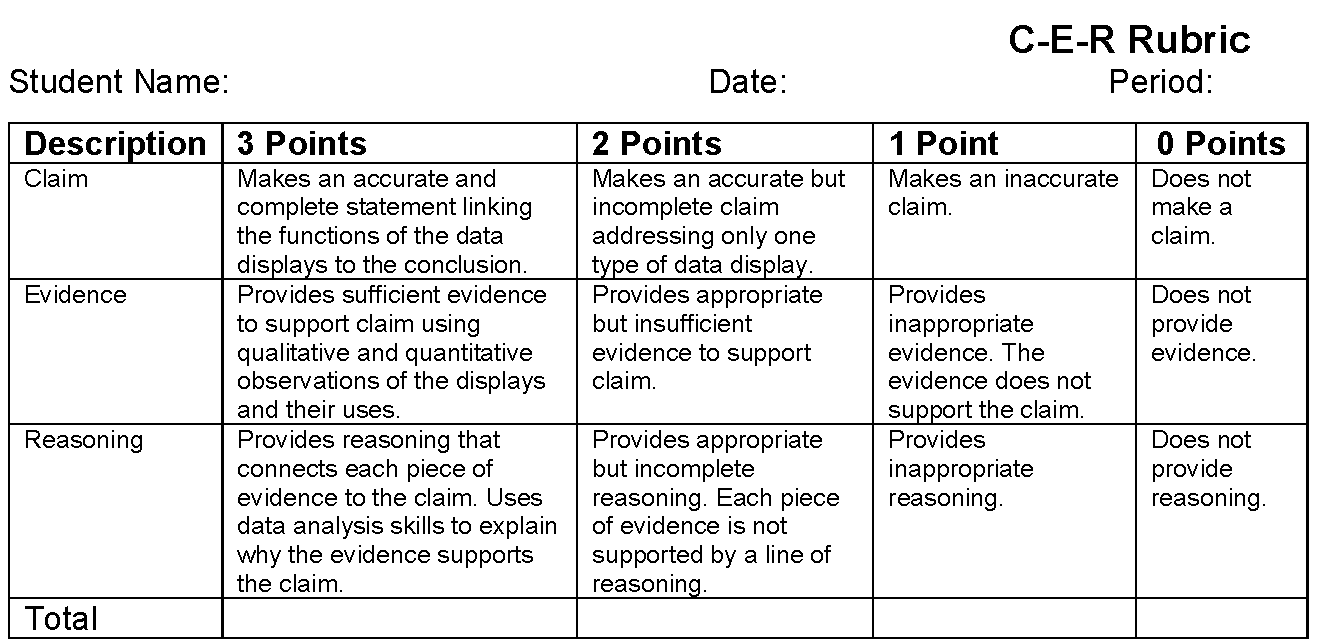
- Students will use the Claim-Evidence-Reasoning technique to answer the question.
Disciplinary Core Ideas:
- ESS3B: Natural Hazards
Crosscutting Concepts:
- Scale, Proportion, and Quantity
Science and Engineering Practices:
- Developing and Using Models
- Analyzing and Interpreting Data
- Using Mathematics and Computational Thinking
- Analyze how the phenomenon changes with location
- Identify patterns and relationships in data
- Use statistics appropriate to the shape of the data distribution to compare center (median, mean) and spread of two or more different data sets.
- Represent data with plots on the real number line with a Histogram, Box Plot and Scatter Plot
The driving question behind investigating tropical cyclones and different types of data displays is: Which data display is most useful for determining the risk of a tropical cyclone in a given area and preparing an effective emergency plan?
Tropical Cyclones
- Tropical cyclones are also called hurricanes or typhoons depending upon where they form.
- Share background information from these options. Choose the best option for the class.
- Inform students that some homeowners who live in high risk locations are required to purchase flood insurance. Homeowners can take steps to protect their homes from floods and high winds as well. It is also important to have a plan. Students can explore the following resources for more information.
Sources:
- https://pmm.nasa.gov/education/articles/how-do-hurricanes-form
- https://earthobservatory.nasa.gov/Features/Hurricanes/hurricanes_3.php
- https://pmm.nasa.gov/education/articles/how-do-hurricanes-form
- https://oceanservice.noaa.gov/facts/hurricane.html
- https://www.nasa.gov/audience/forstudents/5-8/features/nasa-knows/what-are-hurricanes-58.html
- https://scijinks.gov/hurricane/
- http://www.cert-la.com/downloads/education/spanish/FEMA_FS_hurricanes_508_8-15-13.pdf
- https://www.ready.gov/hurricanes
- The Graph Choice Chart by The Maine Data Literacy Project*, based on a work at participatoryscience.org * Licensed under a Creative Commons Attribution-ShareAlike 4.0 International License.
Students should be familiar with histograms, box plots and scatter plots.
Students may not understand that data displays or graphs summarize information in various ways and that not all graphs are appropriate for analyzing data with a particular questions in mind.
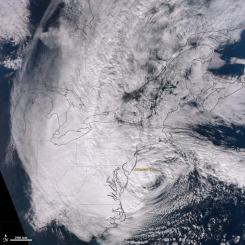
Hurricanes are large, swirling storms with winds of 119 kilometers per hour (74 mph) or higher. That's quicker than a cheetah can run which is the fastest animal on land.
Hurricanes are said to be the most violent storms on Earth. These storms are also called by other names, such as typhoons or cyclones, depending on where they occur. The scientific term for these storms is “tropical cyclone.” Only tropical cyclones that form over the Atlantic Ocean or eastern Pacific Ocean are called "hurricanes”. Whatever they are called, tropical cyclones all form the same way. (see https://pmm.nasa.gov/education/articles/how-do-hurricanes-form)
Because tropical cyclones are like giant engines that use warm, moist air as fuel, they form only over warm ocean waters near the equator. The number of hurricanes occurring each year varies widely from ocean to ocean, depending on how much warm ocean water exists. The most active area is the northwestern Pacific Ocean, which contains a wide expanse of warm ocean water. On average, twenty six tropical cyclones form in this region each year, of which seventeen reach hurricane (typhoon) status. In contrast, the Atlantic Ocean averages about ten storms annually, of which six reach hurricane status. Compared to the Pacific Ocean, the Atlantic is a much smaller area, and therefore supports a smaller expanse of warm ocean water to fuel storms. The Pacific waters also tend to be warmer, and the layer of warm surface waters tends to be deeper than in the Atlantic. Overall, about 80 tropical cyclones occur annually across the globe, one-third of which achieve hurricane status.The frequency and intensity of hurricanes varies significantly from year to year, and scientists haven’t yet figured out all the reasons for the variability. (see https://earthobservatory.nasa.gov/Features/Hurricanes/hurricanes_3.php)
Tropical cyclones usually weaken when they hit land, because they are no longer being "fed" by the energy from the warm ocean waters. (see https://pmm.nasa.gov/education/articles/how-do-hurricanes-form)
- General Scientist - A scientist is a person that works in a specific field to acquire or uncover knowledge related to the natural world.
- Meteorologist – as defined by the American Meteorological Society - a person with “specialized education who uses scientific principles to explain, understand, observe, or forecast the earth's atmospheric phenomena and/or how the atmosphere affects the earth and life on the planet.”
- Reporters and Correspondents - Report and write stories for news outlets.
- Standalone Lesson (no technology required)
- Internet Required
Complementary Lesson Plans
Complementary Mini Lessons
Complementary Interactives

Grade Band
- 6-8
- 9-12
Time
- 50 minutes
Visualization Tool
NGSS Three Dimensional Learning
- See drop-down menu at the bottom of the page