Mini Lesson/Activity
Tropical Cyclone Counts Model
Overview
Interpret the map, or model, to find patterns in the occurrence of tropical cyclones from 1842 through 2018.
Student Directions
Background
Tropical cyclones are sometimes called hurricanes or typhoons. They are large storms with strong wind that form over water and can travel over land. That means they can have an impact on bodies of water, the atmosphere and land.
Scientists use maps to model tropical cyclones. The image below is a model that shows how many hurricanes have been in each location from 1842 – 2018. Maps, like this one, show changes in different locations. In this mini lesson, you will examine a map with data and answer questions.
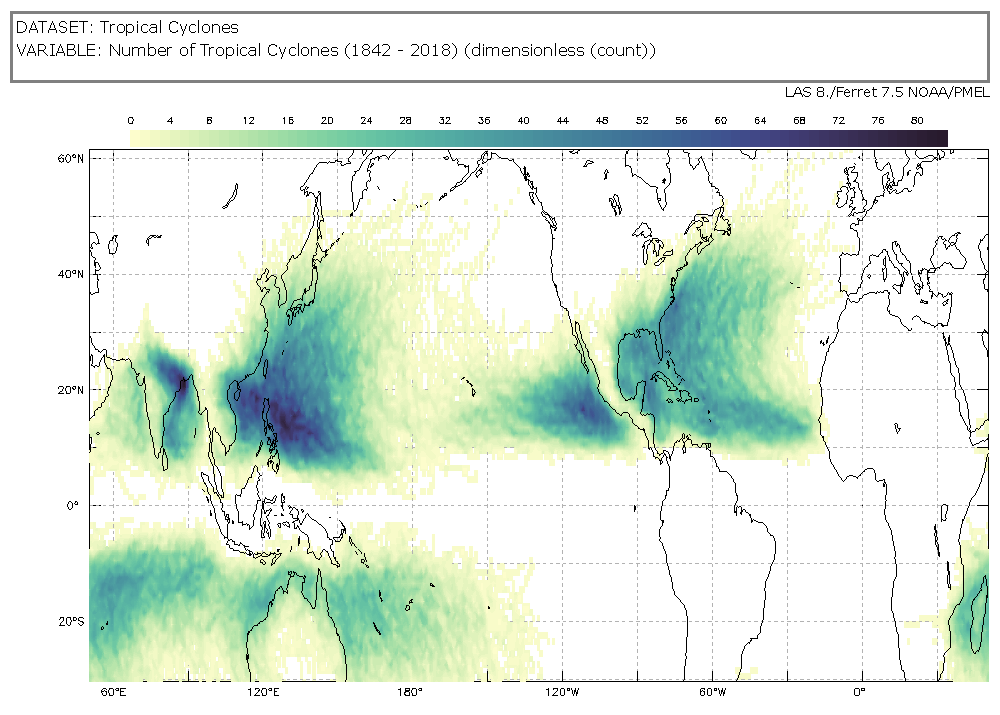
https://mynasadata.larc.nasa.gov/sites/default/files/2020-04/Tropical%20Cyclone%20Counts%20Yellow%20to%20Blue%20thumbnail_0.png
Steps
Use the Tropical Cyclone Counts Map Image to answer the questions. Check with your instructor on how to submit your answers.
- What does the information on the map show?
- What do the dark colors on the map represent?
- Point to a spot on the map that is not white. How many tropical cyclones, or hurricanes, have there been at that spot between 1842 and 2018?
- Where do the most hurricanes form?
- What do you notice about the image?
- What questions do you have about the image?
Teacher Note
Teachers, these mini lessons/student activities are perfect "warm up" tasks that can be used as a hook, bell ringer, exit slip, etc. They take less than a class period to complete. Learn more on the "My NASA Data What are Mini Lessons?" page.
Teachers who are interested in receiving the answer key, please complete the Teacher Key Request and Verification Form. We verify that requestors are teachers prior to sending access to the answer keys as we’ve had many students try to pass as teachers to gain access.
Disciplinary Core Ideas:
- ESS2A: Earth Materials and Systems
- ESS2D: Weather and Climate
Crosscutting Concepts:
- Patterns
- Systems and System Models
Science and Engineering Practices:
- Developing and Using Models
- Obtaining, Evaluating and Communicating Information
Complementary Mini Lessons

Document Resources
Grade Band
- 3-5
Time
- 30 minutes
Visualization Tool
NGSS Three Dimensional Learning
- See drop-down menu at the bottom of the page