Interactive Models
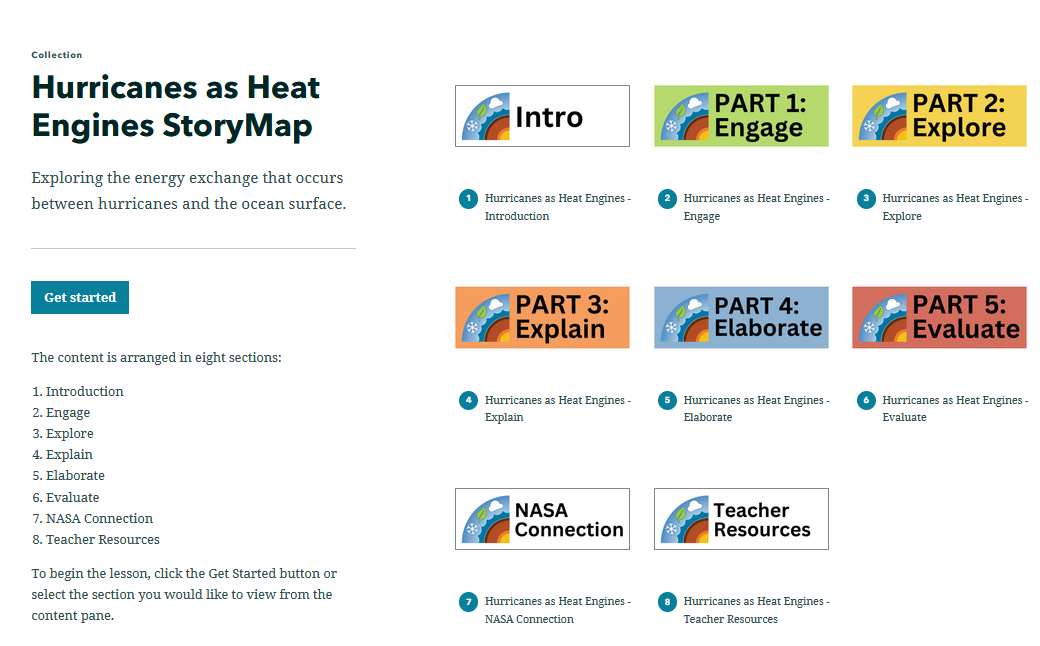
Hurricanes as Heat Engines StoryMap
Overview
Using various visualizations (i.e., images, charts, and graphs), students will explore the energy exchange that occurs when hurricanes extract heat energy from the ocean. This StoryMap is intended to be used with students who have access to the internet in a 1:1 or 1:2 setting.
![]()
Materials Required
Resources Needed Per Student:
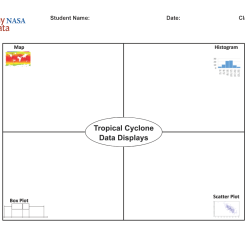
- Student Data Sheet or Student Data Form
- Computer/Tablet
- Internet Access
- Link to Hurricanes as Heat Engines StoryMap
Directions
- Using an internet accessible device, students open the link to the Hurricanes as Heat Engines StoryMap Lesson to begin their exploration of this phenomenon.
- Distribute the Hurricanes as Heat Engines StoryMap Student Data Sheet. Have students navigate on their own through the Engage, Explore, Explain, Elaborate, and Evaluate tabs of the StoryMap to answer the questions and complete the activities on their student data sheet.
Teacher Note
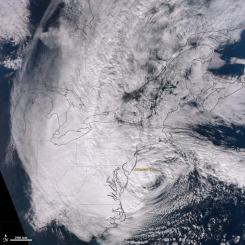
The passage of a hurricane causes a large transfer of heat between the ocean surface and the atmosphere. It also causes surface waters to diverge, bringing cooler water from below to the surface (upwelling). These effects are so large that they can be seen by a drop in sea surface temperature (SST) in satellite data observations along the path of the storm. The cooler water conditions may last for a week or longer after the storm.
To learn more, visit:
- The Hurricane Dynamics Phenomena page for background information
Teachers who are interested in receiving the answer key, please complete the Teacher Key Request and Verification Form. We verify that requestors are teachers prior to sending access to the answer keys as we’ve had many students try to pass as teachers to gain access.
Disciplinary Core Ideas:
- ESS2A: Earth Materials and Systems
- ESS3B: Natural Hazards
Crosscutting Concepts:
- Patterns
- Systems and System Models
Science and Engineering Practices:
- Developing and Using Models
- Analyzing and Interpreting Data
- Students will analyze NASA sea surface temperature data to use as evidence to explain a phenomenon.
- Students will explore how hurricanes gain energy from the ocean surface.
- How is the development of a hurricane affected by sea surface temperature?
- How is thermal energy transferred within a hurricane system?
- How does a hurricane affect the different spheres within the Earth System?
National Geography Standard
How to use maps and other geographic representations, tools, and technologies to acquire, process, and report information from a spatial perspective.
SCIENCE: Atmospheric Scientist
TECHNOLOGY: Geospatial Information Scientists and Technologists
ENGINEERING: Software Engineer
- Internet Required
- One-to-One (tablet, laptop, or CPU)
- One-to-a-Group
- Visualization Tool Required
Complementary Lesson Plans


Document Resources
Interactive Files
Grade Band
- 6-8
- 9-12
Time
- 90 minutes
Visualization Tool
NGSS Three Dimensional Learning
- See drop-down menu at the bottom of the page