Mini Lesson/Activity
Hurricane Harvey's Effect on Soil Moisture
Overview
In this mini-lesson, students analyze soil moisture quantities associated with Hurricane Harvey around Houston, Texas on August 25, 2017.
Student Directions
Hurricane Harvey dropped record-breaking amounts of rainfall on August 25, 2017 in southeastern Texas. This includes the greater Houston region.
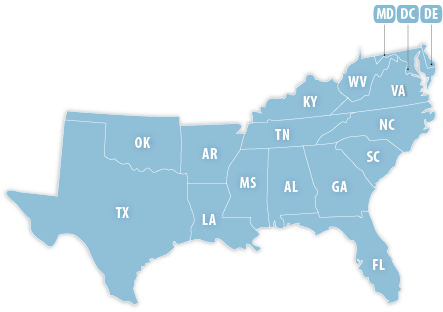
Credit: U.S. Bureau of Labor Statistics
https://mynasadata.larc.nasa.gov/sites/default/files/inline-images/south_map.png
Note: Houston is the 4th largest city in the United States. Over a twenty-year span (1997 to 2016), this area added almost 1000 km2 of impervious surfaces (such as concrete, asphalt, etc.) to the landscape. This is almost 187,000 football fields of pavement, concrete, and buildings. (Source: Rice University)
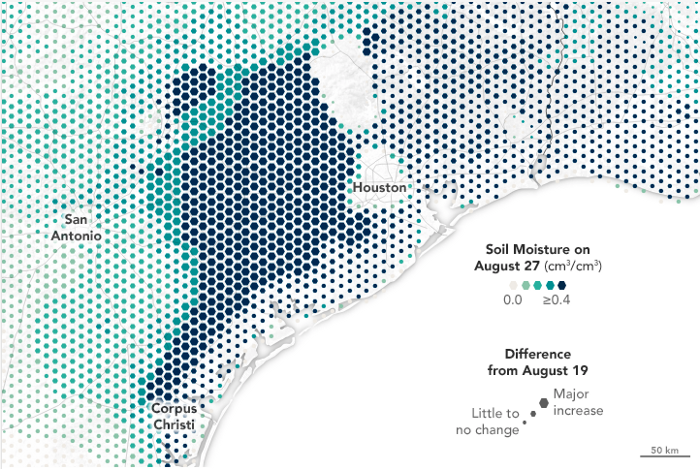
Credit: These data were collected by NASA’s Soil Moisture Active Passive satellite using a radiometer. NASA Earth Observatory image by Joshua Stevens, using soil moisture data courtesy of JPL and the SMAP science team. Note: Soil moisture is expressed in volumetric terms, water by volume/volume of soil.
https://mynasadata.larc.nasa.gov/sites/default/files/inline-images/1_xgfSgHLej33MN8upelOo-g.png
- Answer the questions below. Check with your instructor on how to submit your answers.
- Explain what the size of the dot represents.
- Describe what the color represents.
- Identify the area that was the most impacted by Hurricane Harvey? How do you know?
- Compare the urban area of Houston and the soil moisture changes resulting from Hurricane Harvey. How does this urban area compare to areas to the east and west?
- Brainstorm the factors that may have contributed to this difference.
Teacher Note
Teachers, these mini lessons/student activities are perfect "warm up" tasks that can be used as a hook, bell ringer, exit slip, etc. They take less than a class period to complete. Learn more on the "My NASA Data What are Mini Lessons?" page.
Teachers who are interested in receiving the answer key, please complete the Teacher Key Request and Verification Form. We verify that requestors are teachers prior to sending access to the answer keys as we’ve had many students try to pass as teachers to gain access.
Disciplinary Core Ideas:
- ESS3B: Natural Hazards
- ESS3C: Human Impacts on Earth Systems
Crosscutting Concepts:
- Cause and Effect
- Scale, Proportion, and Quantity
- Stability and Change
Science and Engineering Practices:
- Analyzing and Interpreting Data

