
Grade Level: 3-5,
6-8,
9-12
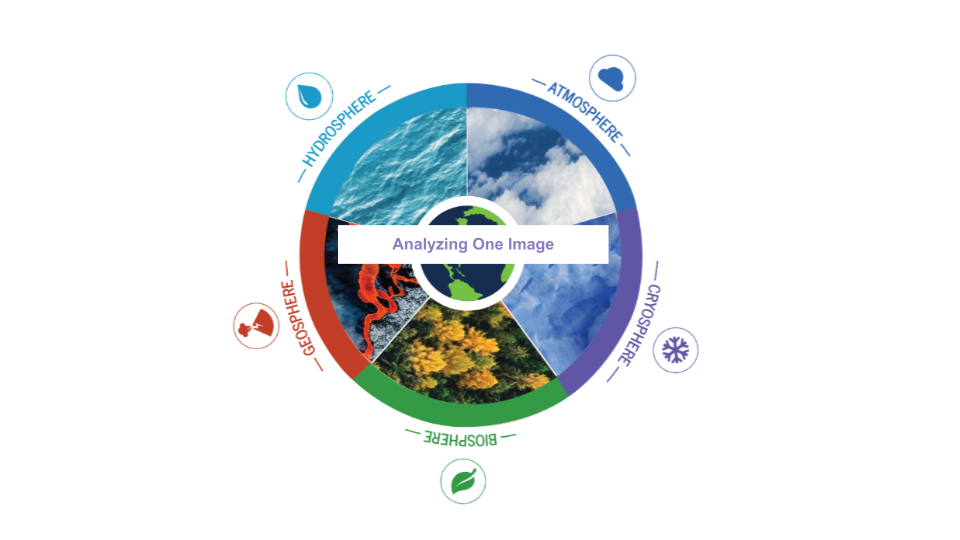
The Earth System Satellite Images, along with the Data Literacy Cubes, helps the learner identify patterns in a specific image.
The Earth's system is characterized by the interaction of processes that take place on molecular (very small) and planetary (very large) spatial scales, as well as on short and long time scales. Before scientists may begin their work with these data, it is important that they understand what the data are.

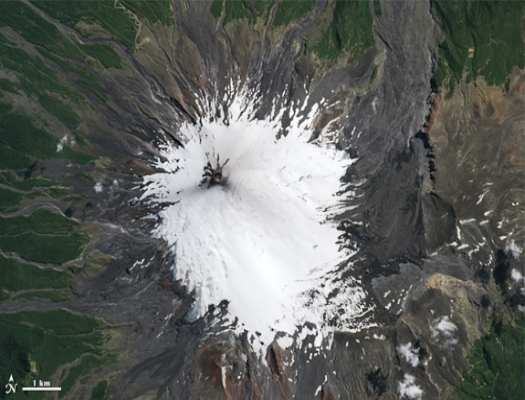
Students use scale to determine the area of volcanic deposits following the March 3, 2015 eruption of Chile's Mount Villarrica stratovolcano, one of the country's most active volcanoes.
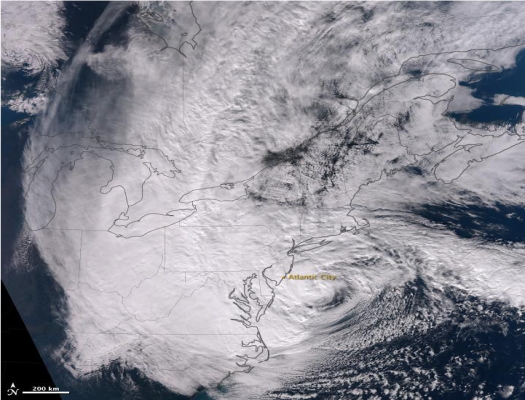

Students investigate the effects of Hurricane Sandy and make a scale model of the storm over the continental United States to assess the area of impact.
In this activity, students use satellite images from the NASA Landsat team to quantify changes in glacier cover over time from 1986 to 2018.
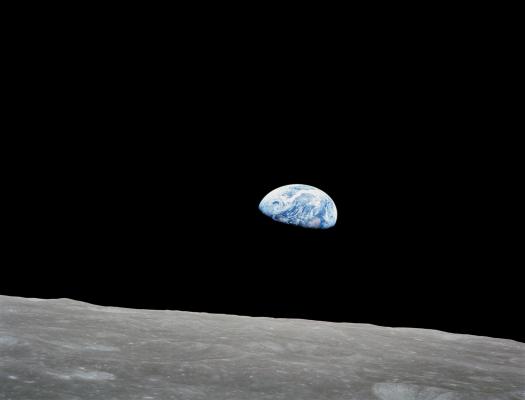
Students are introduced to the Earthrise phenomenon by seeing the Earth as the Apollo 8 astronauts viewed our home planet for the first time from the Moon. They will analyze a time series of mapped plots of Earth science variables that NASA monitors to better understand the Earth
The Earth System Satellite Images, along with the Data Literacy Cubes, helps the learner identify patterns in a specific image.

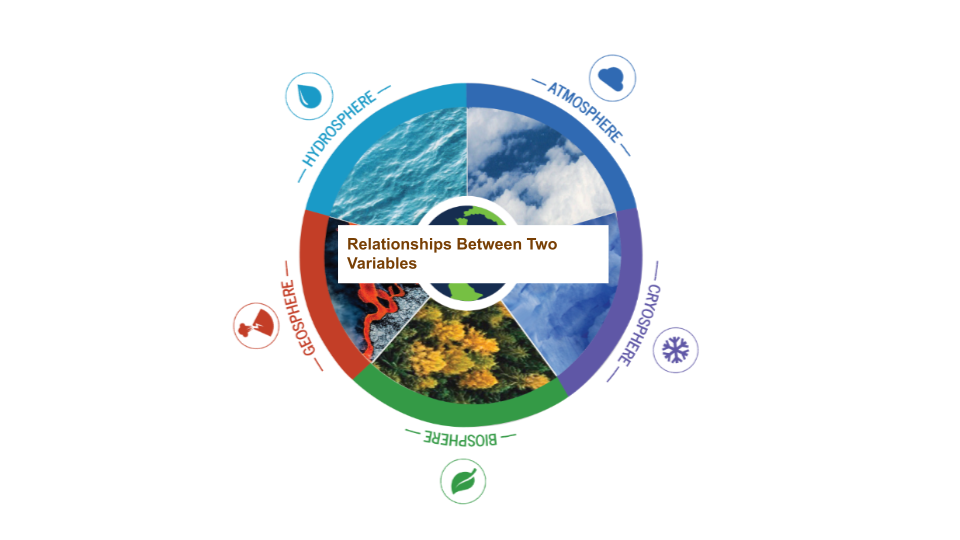
The Earth System Satellite Images, along with the Data Literacy Cubes, help the learner visualize how different Earth system variables change over time, establish cause and effect relationships, identify patterns, and determine relationships among variables.
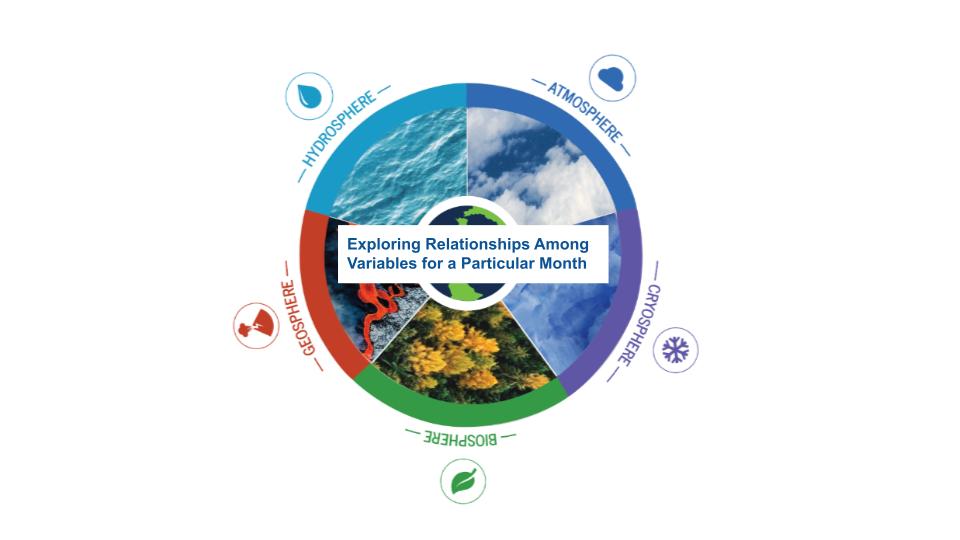
The Earth System Satellite Images, along with the Data Literacy Cubes, help the learner visualize how different Earth system variables change over time, identify patterns, and determine relationships among two variables in three months.
The Earth System Satellite Images, along with the Data Literacy Cubes, help the learner determine relationships among variables.

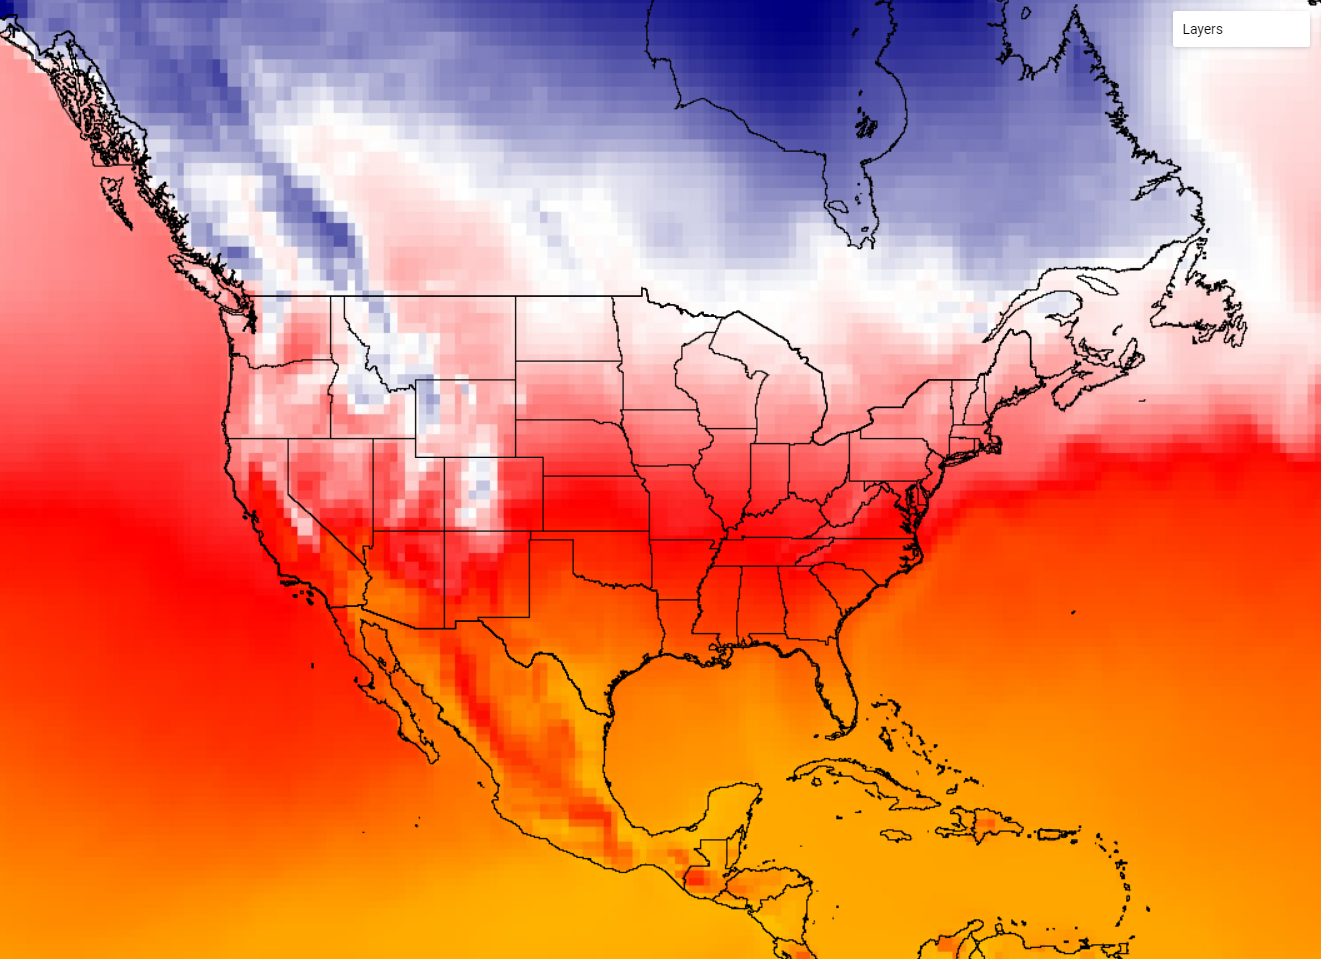
The Earth System Satellite, help the learner visualize how different Earth system variables change over time. In this lesson, students will graph six points for a location over one year.
The Earth System Satellite Images, along with the Data Literacy Cubes, helps the learner identify patterns in a specific image.