The Earth's system is characterized by the interaction of processes that take place on molecular (very small) and planetary (very large) spatial scales, as well as on short and long time scales. Before scientists may begin their work with these data, it is important that they understand what the data are.
>> Read More >>
Just one moment,
loading Earth as a System...
Featured Mini Lessons
-
-
-
-
-
-
-
Grade Level: 6-8
Arctic sea ice is the cap of frozen seawater blanketing most of the Arctic Ocean and neighboring seas in wintertime. It follows seasonal patterns of thickening and melting. Students view how the quantity has changed from 1979 through 2018.
Grade Level: 6-8
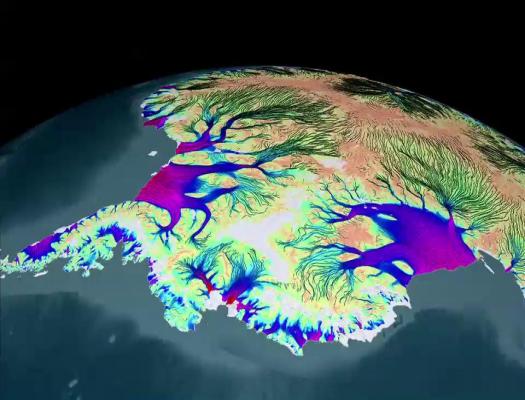
This mini lesson has students explore three visualizations to see the new benchmark map scientists can use to study the extent and speed of changes to the largest ice sheet in the world.
Grade Level: 6-8, 9-12
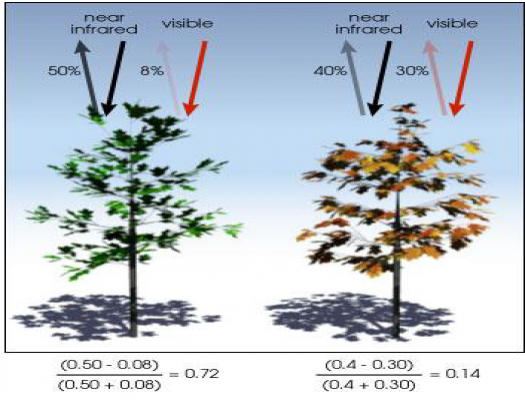
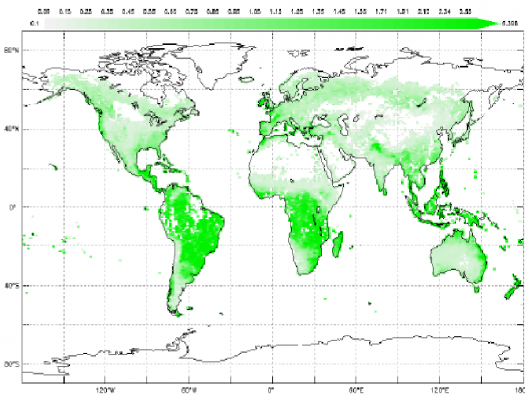
Explore using units for calculations with Normalized Difference Vegetation Index (NDVI). NDVI is a ratio of different light wavelength reflectance which can be used to map the density of green vegetation.
Grade Level: 6-8, 9-12
Explore using units in calculations with the Leaf Area Index (LAI). LAI is a ratio that describes the number of square meters of leaves per square meter of available land surface. Because of the units in the ratio, it is dimensionless.
Grade Level: 6-8, 9-12
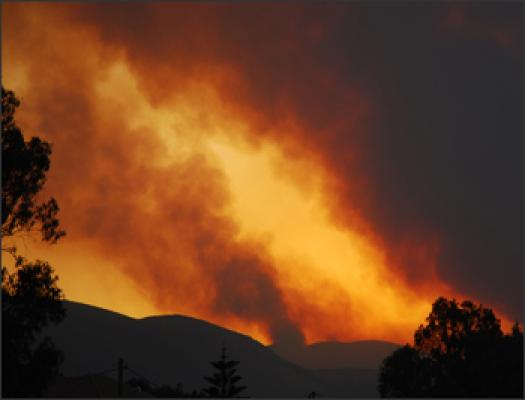
The fires in Greece during the summer of 2007 devastated large tracks of forest and ground cover in this Mediterranean region. Students analyze these data to determine the scale, area, and percentage of the forest impacted by of these fires.
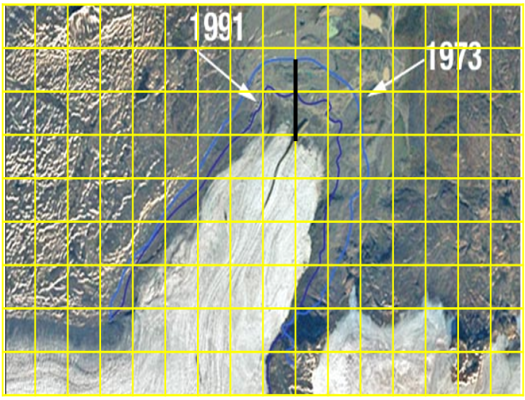
Grade Level: 6-8
The Eyjabakkajökull Glacier is an outlet glacier of the Vatnajökull ice cap in Iceland that has been retreating since a major surge occurred in 1973. Students analyze these maps to identify the scale and rate of change of the glacier loss.
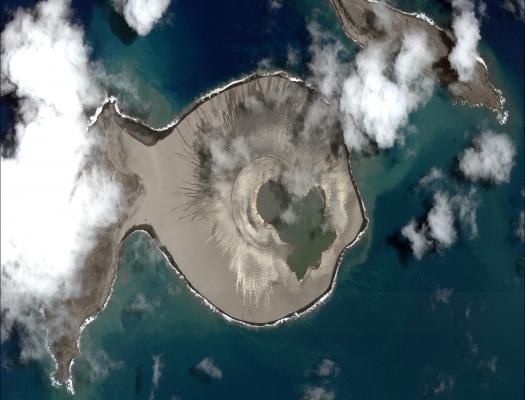
Grade Level: 6-8, 9-12
Students will describe the changes in a newly-formed volcanic island over the first three years of its life.
Previous
Next
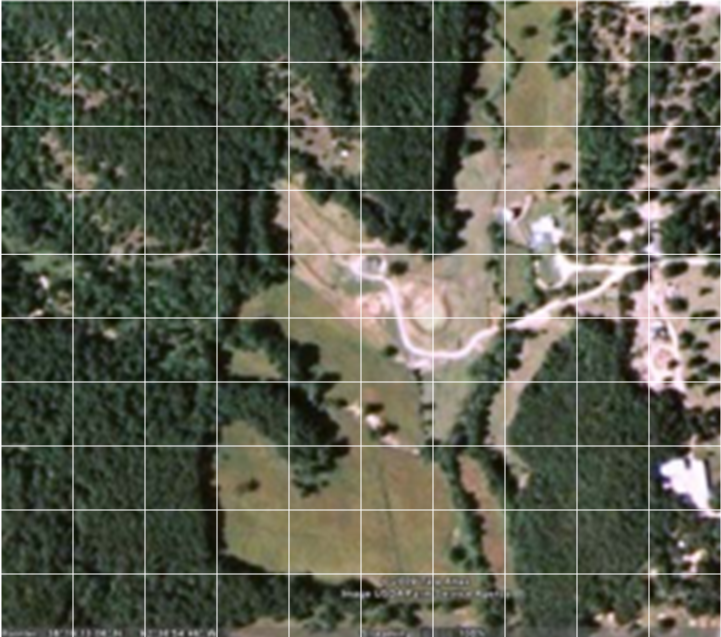
Grade Level: 6-8,
9-12
Carbon dioxide concentration in the atmosphere is affected by many processes including fires, deforestation, and plant respiration. Students will evaluate a Landsat image to determine the rate of carbon dioxide sequestration in a particular area.
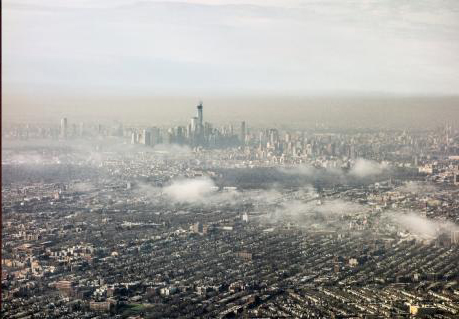
Grade Level: 9-12
Students will synthesize information from maps that show population, concentrations of PM2.5, and PM2.5-attributable mortality across the globe in order to draw conclusions about the relationship between particulate pollution and human health.
Scale, Proportion, and Quantity landing page. Explore maps, graphs, data, and related education resources. These resources include lesson plans, mini lessons, activities, and datasets for teachers and students.