Mini Lesson/Activity
Tracking Monthly Salinity Changes in Our Ocean
Overview
This mini-lesson features time-series graphs of mean salinity at the surface for the Arctic and Antarctic regions. A series of questions guides students in their analysis.
Student Directions
Sea surface salinity describes the amount of salt in the water at the ocean surface. In deep ocean waters, there are currents that are controlled by water density, which depends on the temperature and salinity of the water. Colder, saline water masses are more dense and sink; while warmer, fresher water masses are less dense and rise.
UNITS: Salinity is measured in practical salinity units (psu). These units are equivalent to grams per kilogram, which in this case is 1 gram of dissolved salt per 1 kg of water.
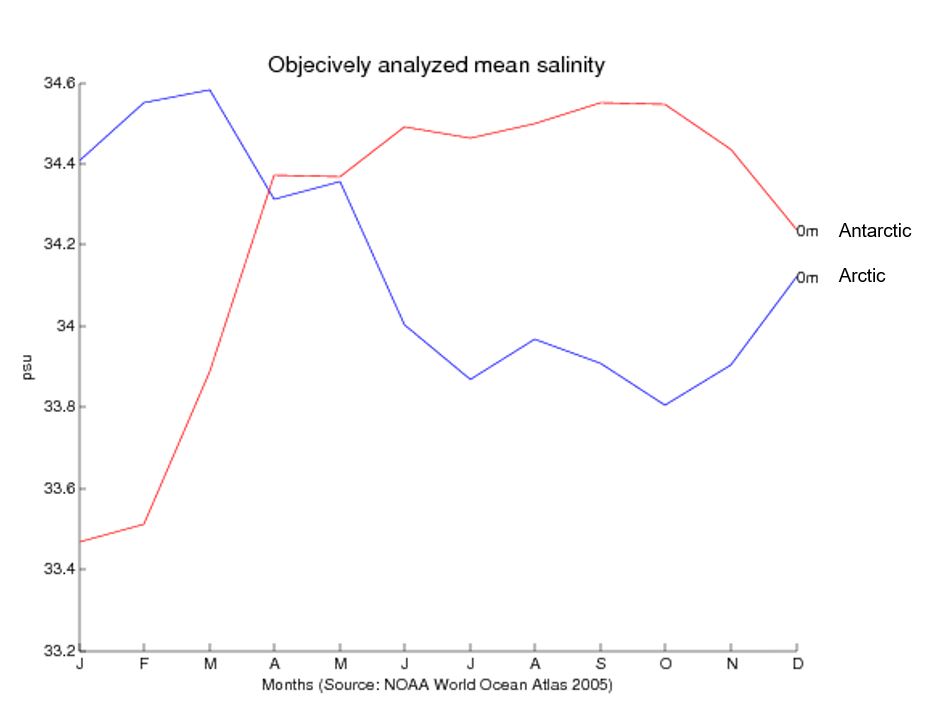
Credit: NOAA World Ocean Atlas 2005
https://mynasadata.larc.nasa.gov/sites/default/files/inline-images/Salinity_Arctic_Antarctic.JPG
Steps:
- Analyze the Monthly Salinity Changes graph to explore the salinity values of our ocean changes over time. The following graph shows salinity time series for two pre-selected profiles in the polar regions. Blue represents the Arctic, and Red represents the Antarctic.
- Observe the salinity values for the polar regions and answer the following questions. Check with your instructor on how to submit your answers.
- What changes do you observe and when do these changes occur?
- Analyze to see if a relationship exists between these variables and explain your findings.
- What may explain this pattern?
- How might changes in salinity affect ocean circulation?
- Do you think the ocean circulation patterns in the Arctic and Antarctic are consistent throughout the year? Explain your reasoning.
Source:
- Levitus, Sydney; US DOC/NOAA/NESDIS > National Oceanographic Data Center (2013). NODC Standard Product: World ocean atlas 2005 (4 disc set) (NCEI Accession 0097967). Salinity. NOAA National Centers for Environmental Information. Dataset. https://accession.nodc.noaa.gov/0097967.
Teacher Note
Teachers, these mini lessons/student activities are perfect "warm up" tasks that can be used as a hook, bell ringer, exit slip, etc. They take less than a class period to complete. Learn more on the "My NASA Data What are Mini Lessons?" page.
Teachers who are interested in receiving the answer key, please complete the Teacher Key Request and Verification Form. We verify that requestors are teachers prior to sending access to the answer keys as we’ve had many students try to pass as teachers to gain access.
Disciplinary Core Ideas:
- ESS2A: Earth Materials and Systems
Crosscutting Concepts:
- Structure and Function
Science and Engineering Practices:
Complementary Mini Lessons


Document Resources
Grade Band
- 6-8
Time
- 15 minutes
Visualization Tool
NGSS Three Dimensional Learning
- See drop-down menu at the bottom of the page