Lesson Plans
What are the causes and effects of ENSO?
Overview
(NOTE: This archived content may contain outdated information or references that may not reflect current policy or programs.)
This investigation is part of the NASA: Mission Geography Module "What are the causes and consequences of climate change?" that guides students through explorations in climatic variability and evidence for global climate change.
Investigation 1 shows that the changing temperatures of the tropical Pacific Ocean greatly affect climate variability. These variations often cause heat waves, droughts, floods, and other disruptive phenomena. Students learn how ENSO works, how it affects the environment, and how it creates problems for humans. In this investigation, students play the role of a Peruvian government policymaker deciding how to allocate Peru’s resources to manage for possible ENSO-related problems. In order to play the role successfully, students first learn how ENSO works, how it affects the environment, and how it creates problems for humans.
Materials Required
Briefings and Logs (one copy of each per student)
- Briefing 1: What are the effects of ENSO?
- Briefing 2: The ENSO game: Predicting and managing for El Niño and La Niña
- Log 1: What are the effects of ENSO?
- Log 2: The ENSO game: Predicting and managing for El Niño and La Niña
- Computer with CD-ROM. The Mission Geography CD-ROM contains color graphics needed for this activity.
- Optional: Access to the Internet, which offers opportunities for extending this investigation
Procedure
Beginning the Investigation
1. Have students bring to class newspaper and magazine clippings and photos of severe weather-related events, such as storms, floods, mudslides, cold spells, heat waves, fires, and droughts. Alternatively, have students conduct Internet searches for this information.
- Have students organize clippings on a bulletin board or Internet data in a database according to types and locations of events.
- Focus class discussion on (a) the locations and spatial patterns of these events, (b) the accompanying human costs in lost lives, injury, and property destruction (emphasizing that these costs are especially difficult to bear when they occur in poor, developing countries), and (c) suggestions for reducing these costs.
- Tell students that this investigation focuses on many of these issues.
Developing the Investigation
2. Hand out copies of Briefing 1 and Log 1: What are the effects of ENSO? to each student or to small groups of students. Students can work on this activity individually, but it is recommended that they work in small groups—pairs or triads are especially recommended.
3. Leaf through the Briefing and Log with the students and point out the underlined questions, which are to be answered on the Log at the end of the materials. Give students a schedule for completing the questions in the Log.
4. Have students read the Background and Objectives and then assist them with any questions they may have.
5. Set students working through the materials, beginning with Part 1. What is ENSO? Emphasize the importance of carefully studying and discussing the images and working together on group answers to the Log questions. Figures 1 and 2 are especially important.
6. To monitor progress and to keep students moving through the materials at about the same pace, ask students to read aloud passages, give their interpretations of the images, and/or use the Log questions (or other questions) to generate class discussion.
7. Part 4. How are human activities affected by ENSO? contains some URLs that students may use to find specific examples of ENSO effects. You may wish to have students skip over these Internet resources or use them to extend their knowledge.
8. You may wish to have students complete the Log before moving on to the ENSO Game.
Log 1:
(Distribute Log and Module 3, Investigation 1: Briefing 1 "What are the effects of ENSO? " and review with students.)
- Why are the easterly trade winds important in ENSO?
- What is the thermocline?
- What are the indicators of a La Niña?
- Why do you think ocean-based measurements are important?
- Describe the different effects of El Niño and La Niña on each of the following regions:
- North America
- El Niño—
- La Niña—
- South America
- El Niño—
- La Niña—
- Africa
- El Niño—
- La Niña—
- Asia
- El Niño—
- La Niña—
- Southeast Asia
- El Niño—
- La Niña—
- North America
- What are the El Niño temperature and precipitation predictions for your hometown?
Move on to the ENSO Game after debriefing the Log.
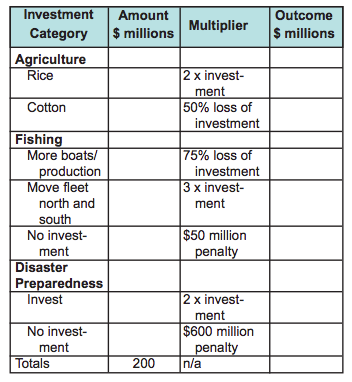
Part 5. The ENSO game may be played as individuals or in small groups. Direct students to proceed with the game as it is presented in Briefing 2: The ENSO game. After deciding whether the data point to an El Niño or La Niña, students can use the table in the ENSO Game Log to record their investment decisions. Tell them to leave blank the two columns marked “Multiplier” and “Outcome” because you will supply them with the multiplier information at the end of the game.
ENSO game scoring, examples, and explanations are in Background below. In debriefing the game, you may wish to hand out this information to the class or put it on a transparency. Also, you may wish to have students share their game decisions by showing their investment tables.
The evidence strongly points to an El Niño event: sea surface temperatures—current of warm water pushed against South American coast (Figure 11), increased precipitation forecasts for Peru—in many cases above 300 percent (Figure 12), and a severely curtailed upwelling (Figure 13). Students who miss this suffer greatly in the game scoring. The Peruvian background is critical for understanding how ENSO affects each of the categories.
The two keys to this game are to have students (1) recognize that the upcoming episode is an El Niño and (2) understand the effects of an El Niño on agriculture, fishing, and disaster preparedness. Students who invest all of the money on one item will lose money, as will students who think that it is a La Niña year. The highest scoring students will invest money in rice production, move the fishing fleets north and south for the season, and invest a substantial percentage of the funds in infrastructure and disaster preparedness. For illustration, three possible outcome scenarios follow:
Student (or group) A, thinking that the upcoming event is a La Niña, invests in the following:
- $100 million—cotton
- $100 million—more fishing boats and fishing production
Outcome: loses $50 million of the cotton investment (-50%) and $75 million on the fishing investment (-75%). The total before the disaster preparedness score would be $75 million. However, because the student (or group) did not account for the floods and other natural disasters, she/they suffer an additional $600 million loss, thus ending with a final loss of $525 million.
Student (or group) B, thinking that the upcoming event is an El Niño, invests in the following:
- $100 million—rice
- $100 million—move the fleet north and south for the season
Outcome: earns $200 million for the rice investment ($100 million x 2) and $300 million on the fishing industry ($100 million x 3). The total score before disaster preparedness scoring is $500 million. But she/they lose $600 million because of no investment in disaster preparedness, so the final loss is $100 million.
Note: Students who do not invest in the fishing industry lose money because the fishing industry in Peru is based on large annual yields. If the fishing industry simply does nothing in the face of an El Niño, it is likely that it will still suffer economic losses.
Student (or group) C, thinking that the upcoming event is an El Niño, allocates investments as follows:
- $100 million—rice
- $50 million—move the fleet north and south for the season
- $50 million—disaster preparedness
Outcome: students who invest across all three categories will always do best in this game. Student (or group) C earns $200 million for the rice investment ($100 million x 2) and $150 million ($50 million x 3) for moving the fleet north and south. Then, the $50 million invested in disaster preparedness earns $100 million ($50 million x 2), for final earnings of $450 million.
Concluding the Investigation
Use the ENSO Game Log key to debrief the game. Have students discuss the evidence they used to decide whether this was an El Niño or a La Niña event.
Generate further discussion around various students’ investment strategies. If you wish to use more math, have students find out the range and average of total scores in the class.
 Log 2:
(Distribute Log and Module 3, Investigation 1: Briefing 2 The ENSO game: Predicting and managing for El Niño and La Niña and review with students.)
- Is an El Niño or a La Niña forming? Support your answer by referring to Figures 11, 12, and 13. The evidence supplied to students strongly points to an El Niño event: sea surface temperatures— warm water pushed against South American coast (Figure 11), increased precipitation forecasts for Peru—in many cases above 300 percent (Figure 12), and a severely curtailed upwelling (Figure 13).
-
Use the table to the right to allocate a total of $200 million on any combination of investments. Make investments in increments of $10 million.
- Give your reasons for your investment decisions in the spaces provided below. Student reasons will vary but should be logical and based primarily on their knowledge of the effects of El Niño as well as of the Peruvian economy.
Refer students to the Objectives to have them summarize what they learned with the activity:
- interpretation of satellite images;
- how, when, and where ENSO events occur;
- how ENSO events affect humans in different places; and
- how to use geographic information to plan and make decisions.
Background on The ENSO Game Scoring:
Agricultural Investments:
Rice production
- Multiplier: 2 x original investment
- For example, for a $50 million investment in rice, the payoff is $100 million.
The upcoming El Niño episode brings torrential rains to the highlands and coasts of Peru. Rice, because it thrives in wet conditions, prospers this year. The rice industry in Peru experiences a bumper crop. Your investment helps to feed thousands of people and generates foreign exchange for Peru’s economy when rice is exported to neighboring countries that do not invest in rice production.
Cotton production
- Multiplier: 50% loss of original investment
- For example, for a $50 million investment in cotton, the payoff is $25 million.
The torrential rains of the El Niño do not let up at the end of the growing season. Although your cotton crops grow fairly well this year, heavy rains at the end of the season seriously damage the cotton. Poor climate prediction leads to a serious economic hardship for cotton growers and a setback to economic development in the country.
Fishing Industry Investments:
More fishing boats and fishing production
- Multiplier: 75% loss of original investment
- For example, for a $100 million investment in boats and fishing, the payoff is $25 million.
The El Niño event reduces cold upwelling along the coast. Fewer nutrients are brought to the surface. Consequently, fewer phytoplankton grow, fewer fish arrive to feed on the phytoplankton, and fewer fish are caught by fishermen. The fishing industry along the coast suffers economic hardship. Investment in more fishing boats and production triggers overfishing along the coast of the few species in the waters. This, in turn, leads to unemployment in the fishmeal and manufacturing industries and a substantial loss of your investment.
Move the fleet north and south for the season
- Multiplier: 3 x original investment
- For example, for a $50 million investment to move the fleet, the payoff is $150 million.
During the El Niño, the fishing fleet moves to the north and south to take advantage of the shift in upwelling.Because of good climate predictions, the fleet captures a great quantity of fish, which are processed in Peru, leading to substantial economic growth for the country.
No investments in fishing this year
- Multiplier: $50 million penalty
- Subtract $50 million from your total.
During the El Niño period, the fishing industry has no funds with which to fish. Fishermen and others working in the industry are unemployed and suffer economic hardship. Economic experts estimate that the fishing industry loses $50 million during the El Niño episode.
Disaster Preparedness Investments:
Invest in disaster preparedness
- Multiplier: 2 x original investment
- For example, for a $75 million investment in infrastructure for disaster preparedness, the payoff is $150 million.
During the El Niño episode, torrential rains fall on the coasts and mountains of Peru. This creates a potential for serious flooding problems. But your planning and investment in infrastructure saves much of the agricultural production from flooding, soil erosion, and destruction. In addition, roads, highways, bridges, and hospitals are saved from flooding, which provides for future economic growth in the upcoming years. Your wise planning and predictions save many lives and homes.
No investment in disaster preparedness
- Multiplier: $600 million penalty
- Subtract $600 million from your total.
During the El Niño episode, torrential rains lead to serious problems. Soil erosion and flooding destroy most of the cotton production in the country. In addition, flooding destroys highways, roads, bridges, and hospitals throughout the country. Furthermore, many homes are destroyed, and many people lose their lives. Poor climate predictions and failure to fully understand the potential threats of El Niño to Peru’s infrastructure have led to consequences that have set the country back many years in economic development.
Disciplinary Core Ideas:
- ESS2A: Earth Materials and Systems
- ESS2D: Weather and Climate
- ESS3D: Global Climate Change
Crosscutting Concepts:
- Cause and Effect
- Scale, Proportion, and Quantity
- Systems and System Models
- Structure and Function
- Stability and Change
Science and Engineering Practices:
- Developing and Using Models
- Planning and Carrying out Investigations
- Analyzing and Interpreting Data
- Constructing Explanations and Designing Solutions
- Obtaining, Evaluating and Communicating Information
- interpret satellite images and maps to draw conclusions about the physical processes producing ENSO;
- explain how, when, and where ENSO events occur;
- give examples of how ENSO events affect humans in different places; and
- use geographic information to develop national plans and investments to prepare for ENSO events in Peru and other places.
- How does a change of energy in one sphere of the Earth System affect another sphere?
- How the energy transferred among the various spheres of the Earth System?
- How is matter shared within the various spheres of the Earth System?
- What other parts of the Earth System may experience the effects of El Nino and how?
- What phenomena are associated with changes in different spheres of the Earth System? What variables appear to be correlated?
See NASA Mission Geography's Background on ENSO here.
Part 1. What is ENSO?
Atmospheric and oceanic variability affect the weather. Weather and climate change through complex links between the oceans and the atmosphere. Sources of variability in weather and climate around the world are changes in water currents, atmospheric pressure, and temperature in the oceans, especially the Pacific Ocean. These changes in the Pacific are often referred to as the El Niño Southern Oscillation, or ENSO. Two types of changes are referred to as El Niño and La Niña.
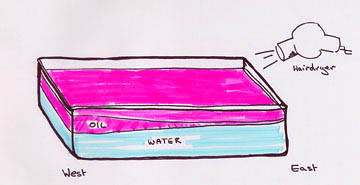
El Niño is the name given to the occasional warming of surface waters in the central and eastern equatorial Pacific Ocean. Under normal conditions, easterly trade winds blow from east to west along the equator and push warm surface water to the western tropical Pacific, where it piles up near Indonesia and the Australian continent. The persistent easterly trade winds are key ingredients of ENSO because they push warm water toward the western Pacific. This gives that area the warmest ocean temperatures on Earth. Usually above 28 degrees C (82 degrees F), parts of this pool are sometimes as warm as 31.5 degrees C (89 degrees F). Because this large pool of warm water is pushed towards the western Pacific, the atmosphere above the ocean is heated, causing favorable conditions for convection and precipitation. In fact, the persistent oceanic heat surrounding Indonesia and other western Pacific islands lead to frequent thunderstorms and some of the heaviest rainfall on Earth.
As the easterly trade winds push warm surface water against the western boundary of the Pacific Ocean, colder, nutrient-rich water comes up from below along the coast of South America to replace it. This is called upwelling. Upwelling helps fish and other animals thrive. In addition, as the warm surface water moves westward, the layer dividing the warm surface water and deep cold water, known as the thermocline, is raised. Because warm water contains more volume than colder water, and because trade winds push the water westward, the sea level is higher on the western side of the Pacific. In fact, the sea level in the Philippines is normally about 60 centimeters (23 inches) higher than the sea level on the southern coast of Panama.
In the upper levels of the atmosphere, the winds blow from west to east, completing a large-scale atmospheric circulation known as the Walker Circulation, named after Sir Gilbert Walker who studied variations in the tropical Pacific atmosphere during the 1920s.
In an El Niño year, which typically occurs every three to seven years, the normal trade winds diminish and the warm pool of water in the western Pacific is free to move back along the equator toward the east and the South American continent. The sea level drops in the west and rises in the east as warm surface water surges along the equator in the form of a pulse, or a Kelvin Wave. In addition, the upwelling of cold water along the South American coast decreases, reducing the supply of nutrients to fish and other animals.
This displacement of warm water affects the atmosphere. The convection and precipitation that previously occurred in the western Pacific shifts with the warm pool to the central and eastern Pacific and usually result in heavier than normal rains over areas such as northern Peru, Ecuador, and other areas in tropical South America. In the western Pacific, the mechanism for precipitation is shut off, and Indonesia and Australia will often experience drought conditions while an El Niño persists.
In a La Niña year, unusually cold ocean temperatures occur in the equatorial Pacific, which is the opposite of an El Niño. Generally, during a La Niña, the easterly trade winds increase in intensity, more upwelling occurs, and the water temperatures along the equator are reduced. This usually results in less cloudiness and rainfall for South America and more rainfall over Indonesia, Malaysia, and northern Australia.
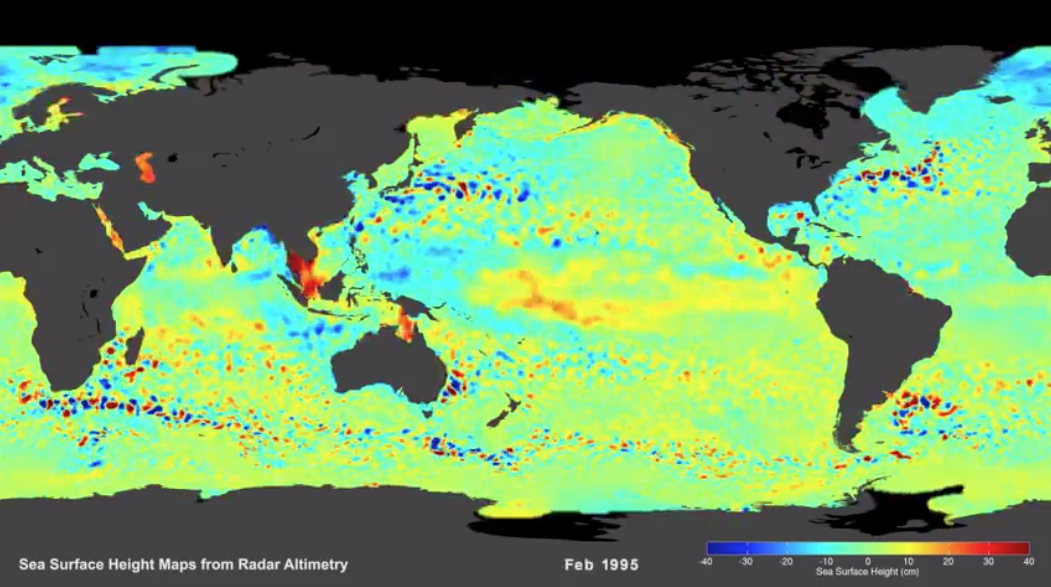
Part 2. How is ENSO measured?
In order to both understand how ENSO works more fully and predict its effects, better measurements of ocean conditions and climate change are needed. Scientists have begun a number of different measurement projects to identify El Niño and La Niña. For example, space-borne sensors are helping to monitor variations of surface wind, sea level, and sea surface temperature along the equator and the west coasts of the American continents. Sea level measurements. NASA satellites can measure sea level for the entire Pacific Ocean within 5 centimeters (2 inches). Images from these satellites can tell us where the warm water is located in the Pacific Ocean because it takes up more volume, thus raising the level of the ocean. Upwelling measurements. Another way of measuring ENSO using satellites is by examining upwelling. Upwelling currents carry nutrients with them, which leads to phytoplankton growth and chlorophyll blooms. Satellites can detect the pigments of the phytoplankton from space. Ocean-based measurements. Another method of identifying when an ENSO event is starting is through measurements taken in the water of the Pacific Ocean. Scientists have created an extensive system of floating and moored buoys, tide gage stations, and ship-based observation systems throughout the Pacific Ocean.
Part 3. How do El Niño and La Niña affect the weather?
The large oceanic and atmospheric changes caused by El Niño and La Niña have a profound effect on Earth’s weather. This is because ENSO occurrences have strong teleconnections to other weather patterns. Teleconnections are atmospheric interactions between widely separated regions. One way of thinking of teleconnections is that changes in the ocean and atmosphere in the Pacific can have a ripple effect on climatic conditions in other parts of Earth. This worldwide message is conveyed by shifts in tropical rainfall and wind patterns over much of the globe. Imagine a rushing stream flowing over and around a series of large boulders. The boulders create a train of waves that extend downstream, with crests and troughs that show up in fixed positions. If one of the boulders were to shift, the shape of the wave train would also change and the crests and troughs would occur in different places. Scientists are studying the relationships between ENSO events and weather around the globe to determine whether links exist. Understanding these teleconnections can help in forecasting droughts, floods, tropical storms, and hurricanes. Based on ENSO patterns and on measurements of the general circulation of the atmosphere and oceans, scientists are predicting abnormally wet, dry, warm, or cold conditions for different regions at different times.
How does ENSO affect weather patterns in North America? During an El Niño, there is a tendency for higher than normal temperatures in western Canada and the upper plains of the United States. This is because the low-pressure system in the Pacific draws up warm air into Canada, some of which filters into the northern United States. Another low-pressure system draws cold moist air into the southern United States, bringing lower than normal temperatures. The same low-pressure system in the southern United States is also responsible for increases in precipitation during an El Niño.
Part 4. How are human activities affected by ENSO? ENSO has many effects on human activities. The economic impacts of the 1982-1983 El Niño, perhaps the strongest event in recorded history, are conservatively estimated to have exceeded $8 billion worldwide from droughts, fires, flooding, and hurricanes (Table 1). Virtually every continent was affected by this strong event. An estimated 1,000 to 2,000 deaths were blamed on El Niño and the disasters that accompanied it. In addition, the extreme drought in the Midwest Corn Belt of the United States during 1988 has been tentatively linked to the “cold event,” or La Niña, of 1988 that followed the ENSO event of 1986-1987. The effects of El Niño and La Niña vary according to the strength of the episodes and the geographic distribution of weather changes. Some areas experience heat waves and droughts, while others have torrential rains and flooding. These specific weather events occur within wet, dry, warm, and cool zones associated with the episodes.
Geography Standards
The World in Spatial Terms
- Standard 1: How to use maps and other geographic representations, tools, and technologies to acquire, process, and report information from a spatial perspective
Physical Systems
- Standard 7: The physical processes that shape the patterns of Earth’s surface
Human Systems
- Standard 10: The characteristics, distribution, and complexity of Earth’s cultural mosaics
Environment and Society
- Standard 14: How human actions modify the physical environment
- Standard 15: How physical systems affect human systems
The Uses of Geography
- Standard 18: How to use geography to interpret the present and plan for the future
One of the most well-known climate patterns that we have come to recognize and better understand is El Niño. Every three to seven years during the months of December and January, the balance between, wind, ocean currents, oceanic and atmospheric temperature and bioshpere breaks down, resulting in a severe impact on global weather.
In a normal year the trade winds blow westward and push warm surface water near Australia and New Guinea. When this warm water builds up in the western Pacific-Ocean, nutrient-rich cold waters are forced to rise up from the deeper ocean just off of the west coast of South America. This colder nutrient-rich water fosters the growth of the fish population.
During an El Niño event the trade winds weaken. Warm, nutrient-poor water is not pushed westward and comes to occupy the entire tropical Pacific Ocean. The cold water is not forced to the surface and the coastal waters of Peru and Ecuador are unusually warm. This warmer water has a devastating impact on their fishing crops which rely on cool waters to thrive. The region also experiences an extremely higher than average amounts of rainfall.
While the impact of an El Niño is most dramatic off of the coast of Western South America its impact is felt in weather around the world. A severe El Niño will enhance the jet stream over the western Pacific and shift it eastward, leading to stronger winter storms over California and southern United States, with accompanying floods and landslides. In contrast, El Niño may also cause severe droughts over Australia, Indonesia, and parts of southern Asia. Further, while El Niño is known to lower the probability of hurricanes in the Atlantic, it increases the chances of cyclones and typhoons in the Pacific.
Oceanography from Space
El Niño is one example of how observing the ocean from space leads to significant insights. Researchers use data from NASA Earth observing satellites to create telling images of how El Niño events form in the ocean, and the factors that may impact its strength and duration in a given climate cycle.
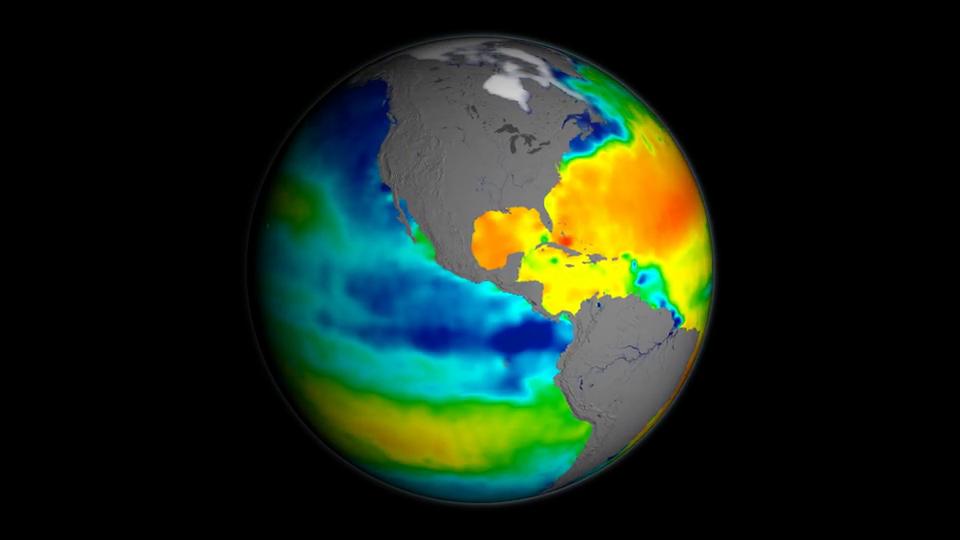
Temperature
NOAA's AVHRR and NASA's Aqua satellite have provided scientists over 25 years of sea surface temperature data. The vast tropical Pacific Ocean receives more sunlight that any other region on Earth. Much of this sunlight is stored in the ocean in the form of heat. During an El Niño water temperatures in the Pacific Ocean may rise on average 3 - 5 degrees above average. This happens as the water in seas around Indonesia, referred to as the Pacific Warm Pool are not forced westward due to weakened east to west trade winds. This pool of warmer water expands westward toward North and South America. Scientists have observed that the size and the frequency of an El Niño is impacted by the fluctuations in the Pacific Warm Pool.
Topography
Currents and tides influence topography, as does temperature. Water expands as it gets warmer, and the lack of cold water dependent nutrients make it less dense. This expanded, less dense water results in a rise in sea level, observable from space. Ocean surface height may rise as much as 6 to 13 inches above normal in some ocean regions during an El Niño.
Winds
The QuikSCAT satellite tracks vector winds, and the Jason and Topex/Poseidon missions track their effects. Typically, the Pacific trade winds blow from east to west, dragging the sunlit warm waters westward where they accumulate in Pacific Warm Pool mentioned above. Weakened east to west trade winds during an El Niño event result in the Pacific Warm Pool waters expanding westward. NASA's QuikSCAT satellite data have shown how trade wind irregularities of less than a few months in duration leading up to an El Niño may have dramatic results on the weather events to follow.
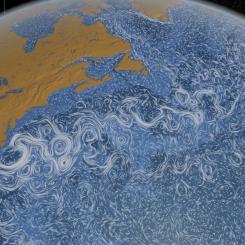
Currents
Currents, or circulation within ocean is influenced primarily by two physical factors, the sinking and rising of warming and cooling water, and movement due to the forcing of the surface waters due to wind. The interactions of ocean water temperature and the strength and direction of winds create currents within the ocean that define the strength and duration of the El Niño. NASA satellite data in combination with data collected from buoy systems and ships provide scientists an expanding understanding of the relationship between ocean currents, weather and climate.
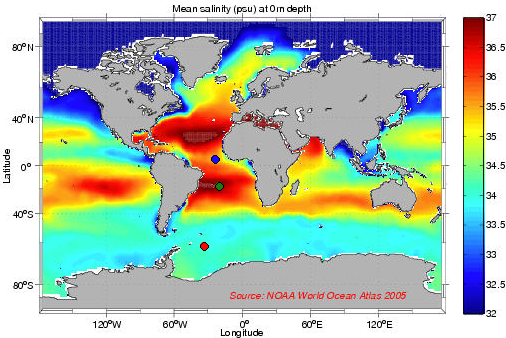
Salinity
Ocean water salt content or salinity is a key variable in understanding the ocean's capacity to store and transport heat. Salinity and temperature combine to dictate the oceans' density. Greater salinity, like colder temperatures, results in an increase in ocean density with a corresponding depression of the sea surface height. In warmer, fresher waters, the density is lower resulting in an elevation of the sea surface. These ocean height differences are related to the circulation of the ocean. Beginning in 2009 the Aquarius mission will take regular measurements of the changes in ocean surface salinity. By knowing the how changes in salinity impact the physical processes in the ocean scientists will be able to create computer models that may more accurately predict El Niño episodes.
Sea Ice
Sea ice modulates planetary heat transport by insulating the ocean from the cold polar atmosphere, and also by modulating the thermohaline circulation of the world ocean. Moreover, the high albedo of snow-covered ice further insulates the polar oceans from solar radiation and introduces another positive feedback in the climate system. The El Niño and its related Southern Oscillation appear to affect regional ice distributions around Antarctica. Understanding this connection between the Southern Oscillation and southern ocean climate and the sea ice cover will substantially improve our understanding of global climate. El Niño episodes affect the Weddell and Ross Seas, areas that are regarded as key sources of cold and dense bottom water that influences global ocean circulation. The strongest links were observed to be in the Amundsen, Bellingshausen and Weddell Seas of the west Antarctic. Within these sectors, higher sea level pressure, warmer air temperature and warmer sea surface temperature are generally associated with the El Niño phase.
Future
By combining data sets from various satellite and in situ measurements we have been able to learn a great deal about how the physical properties of the ocean interact to create climate patterns. Scientists will continue to create models that combine data allowing them to better understand and predict complex ocean processes.
By using data collected from discrete measurements of physical properties of the ocean scientists have learned a great deal about El Niño and how it is impacted by the ocean system. Scientists are just beginning to have data of a time span sufficient to allow them to begin to predict climate patterns longer than the 3 to 7 year El Niño pattern. The ability to study the El Niño climate pattern and create models to simulate conditions, has helped us better predict its impact on our climate and weather.
El Niño is only one of the climate anomalies that scientists have observed;others include the North Atlantic Oscillation, the Atlantic Intertropical Convergence Zone oscillation, the Pacific Decadal Oscillation. Together with El Niño these systems are believed to be responsible for well over fifty percent of the climate variability on Earth. As models are created to simulate the individual patterns they will be combined to create a global model of climate change. If scientists get to the point to where they understand all of these climate cycles they may be able to predict major weather patters months in advance.
- Physical oceanographer - This scientist researches waves, tides, currents, transmission of light and sound in the ocean, and ocean-atmosphere relationships
- Biological oceanographer - This researcher studies marine life forms and their relationships to each other and the environment
- Meteorologists - Professionals who are involved with researching, teaching, consulting, and forecasting weather, climate, and the forces that cause change in our environment.
Complementary Lesson Plans
Complementary Mini Lessons
Complementary Interactives

Grade Band
- 9-12
Time
- 1 week
Visualization Tool
NGSS Three Dimensional Learning
- See drop-down menu at the bottom of the page