

Grade Level: 3-5,
6-8
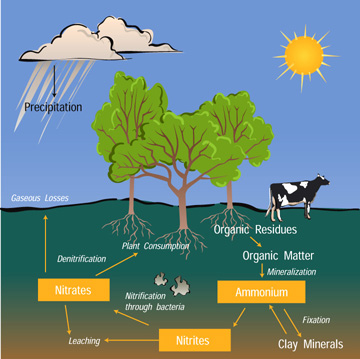
Students will explore the Nitrogen Cycle by modeling the movement of a nitrogen atom as it passes through the cycle. Students will stop in the different reservoirs along the way, answering questions about the processes that brought them to the different reservoirs.