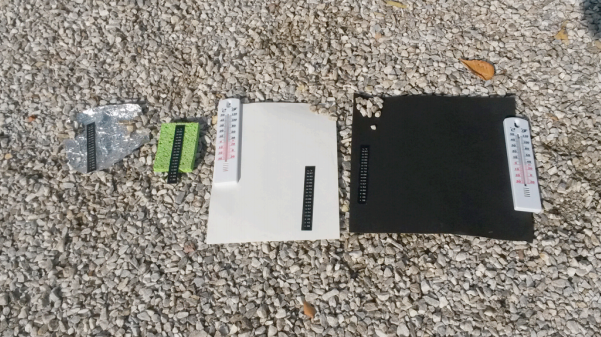
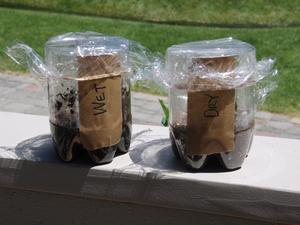
In this activity, students explore three indicators of drought are: soil moisture, lack of precipitation, and decreased streamflows. Students investigate each of these parameters develop a sense for the effects of drought on land.
List of all Atmosphere Lesson Plans
NASA visualizers take data – numbers, codes – and turn them into animations people can see and quickly understand.
Students will examine a 2014-2015 El Niño Southern Oscillation (ENSO) event to identify relationships among sea surface height, sea surface temperature, precipitation, and wind vectors.
Students are introduced to the Earthrise phenomenon by seeing the Earth as the Apollo 8 astronauts viewed our home planet for the first time from the Moon. They will analyze a time series of mapped plots of Earth science variables that NASA monitors to better understand the Earth
This investigation is part of the NASA: Mission Geography Module "What are the causes and consequences of climate change?" that guides students through explorations in climatic variability and evidence for global climate change.
The purpose of this lesson is for students to compare data displays to determine which best answers the driving question. To do this they will evaluate the spread of the data and what the displays show.
This activity was developed by NASA's Global Precipitation Measurement (GPM) team as an introductory experience to a series of lessons about water resources on Earth.
Air, Water, Land, & Life: A Global Perspective
To investigate the different rates of heating and cooling of certain materials on earth in order to understand the heating dynamics that take place in the Earth’s atmosphere.
In this activity, students explore the Urban Heat Island Effect phenomenon by collecting temperatures of different materials with respect to their locations.