Mini Lesson/Activity
Analyzing Seasonal Ice and Snow Extent
Overview
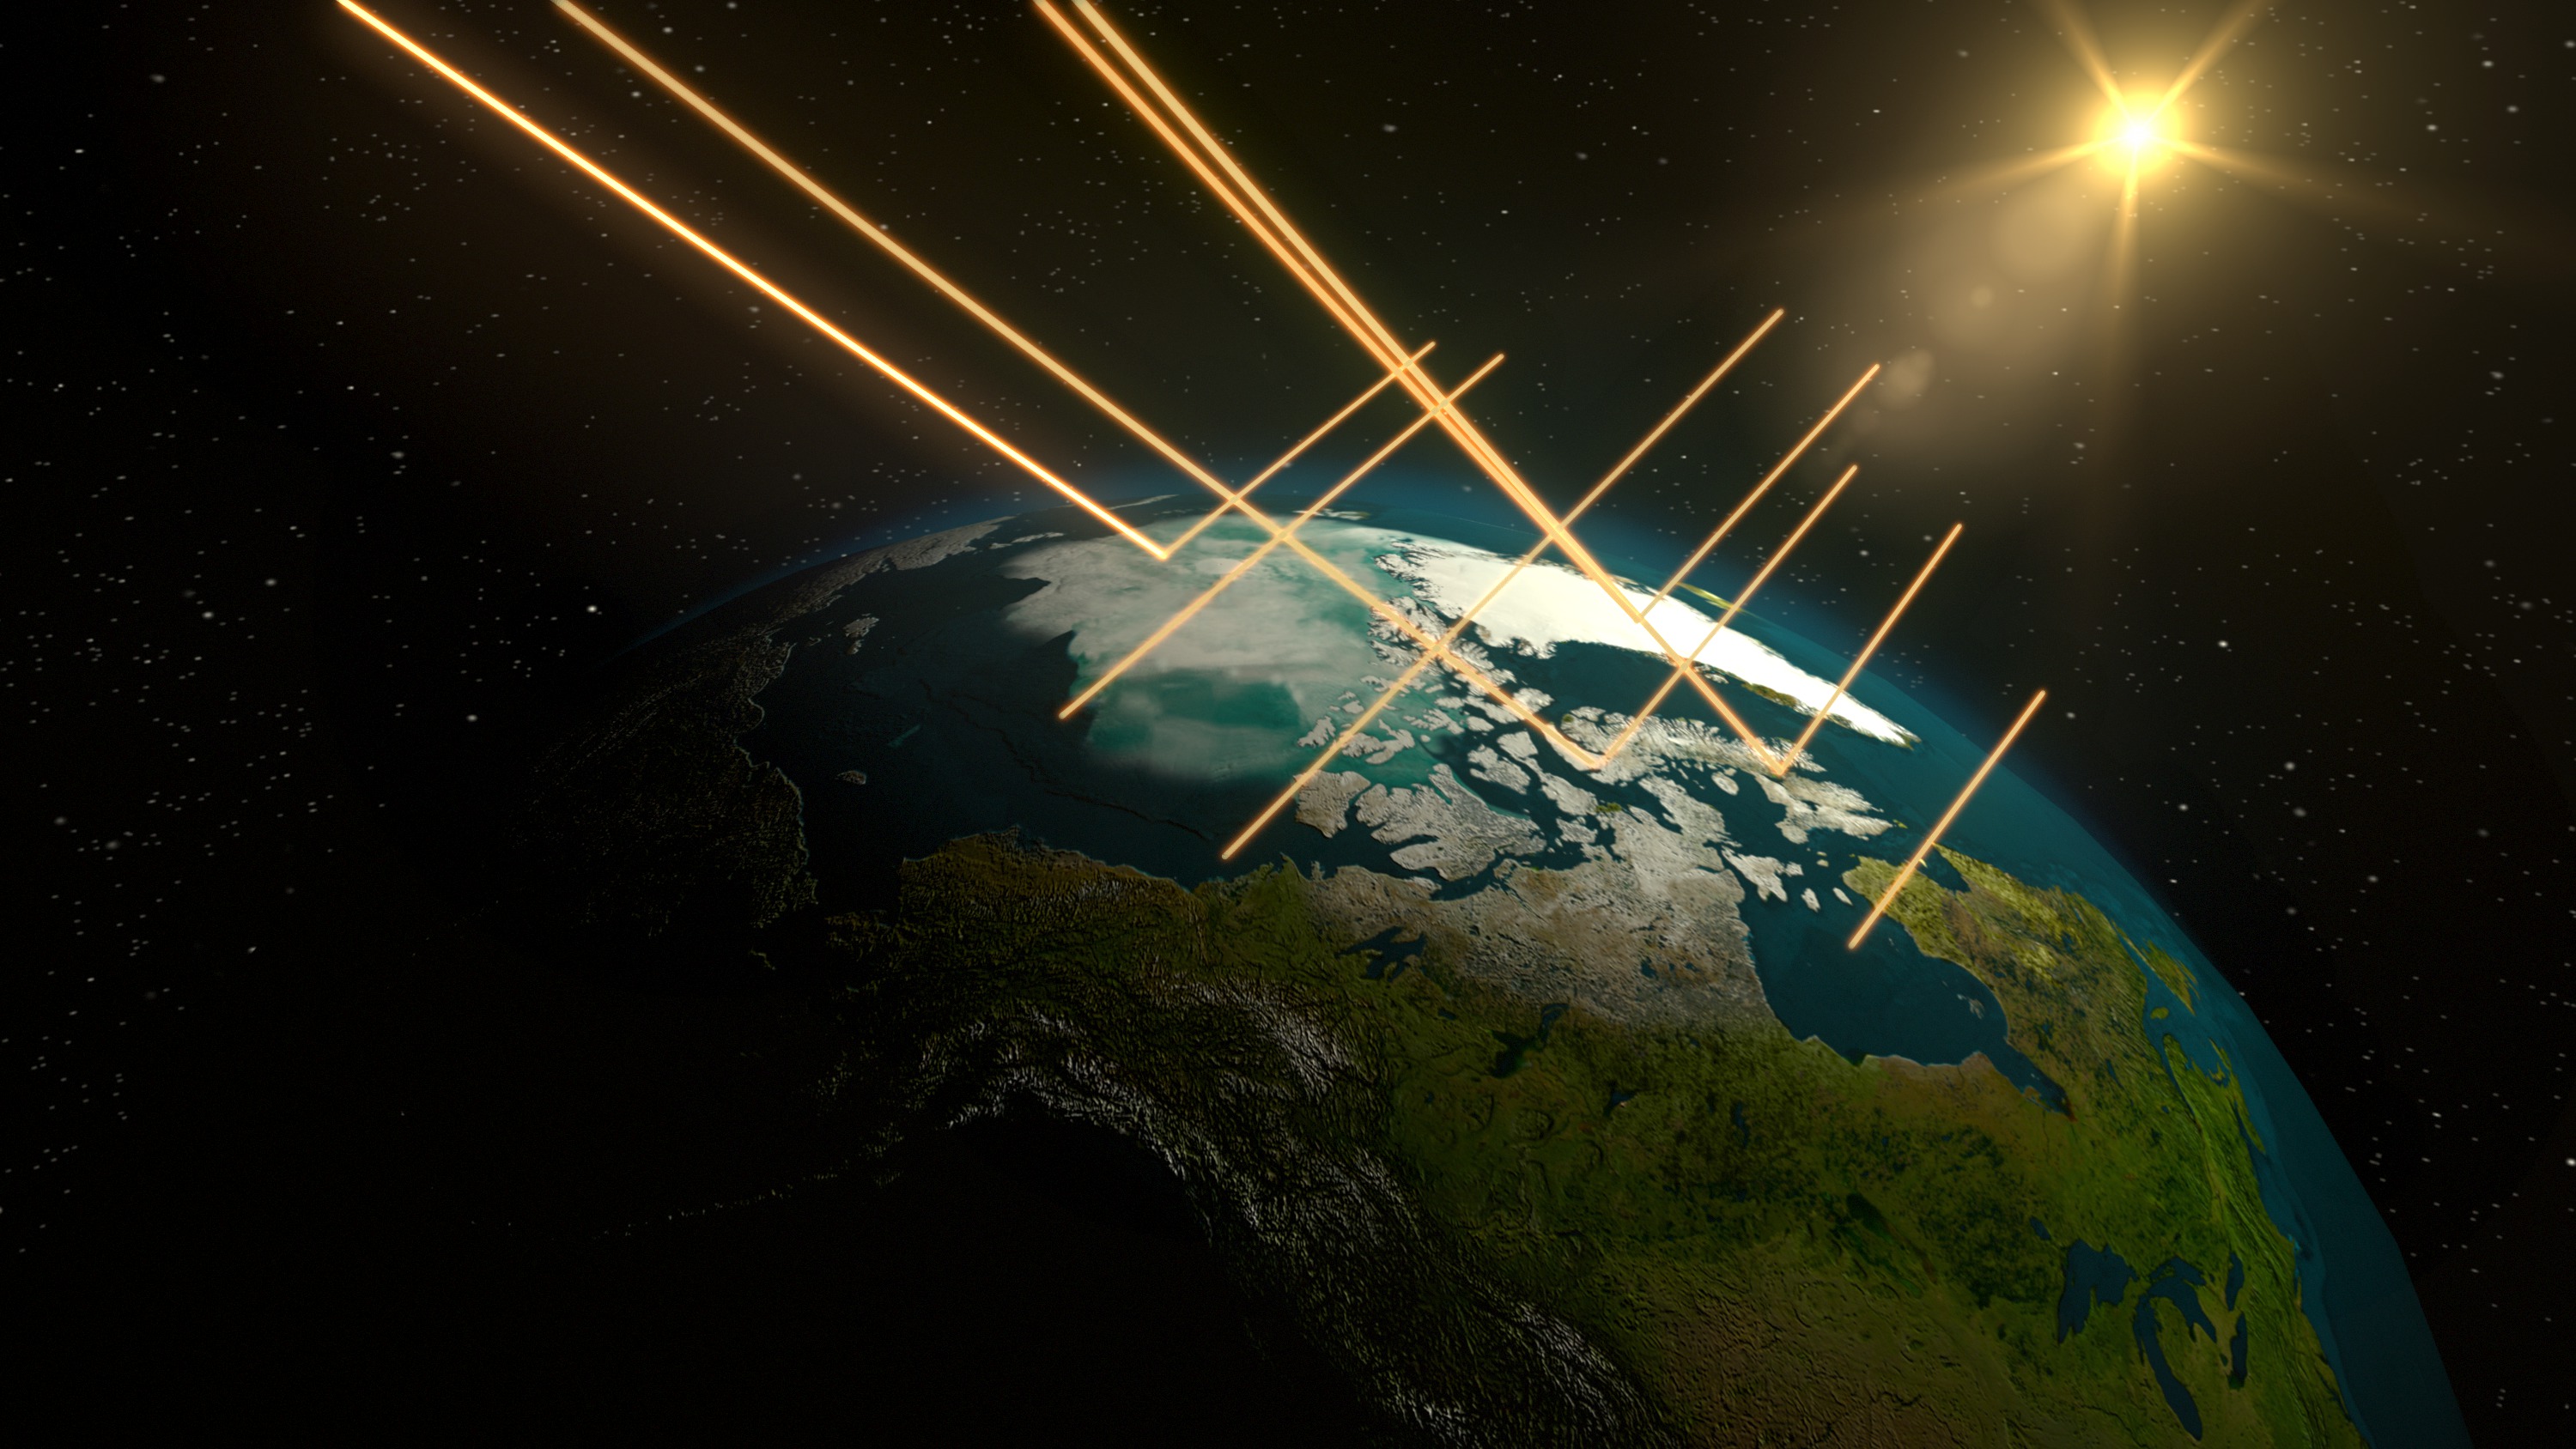
The advance-and-retreat cycle of snow cover drastically changes the whiteness and brightness of Earth. Using two maps created using NASA satellite data for 2017, students review the seasonal differences of snow and ice extent and answer questions on their observations.
Student Directions
The advance-and-retreat cycle of snow cover can change the whiteness and brightness of Earth.
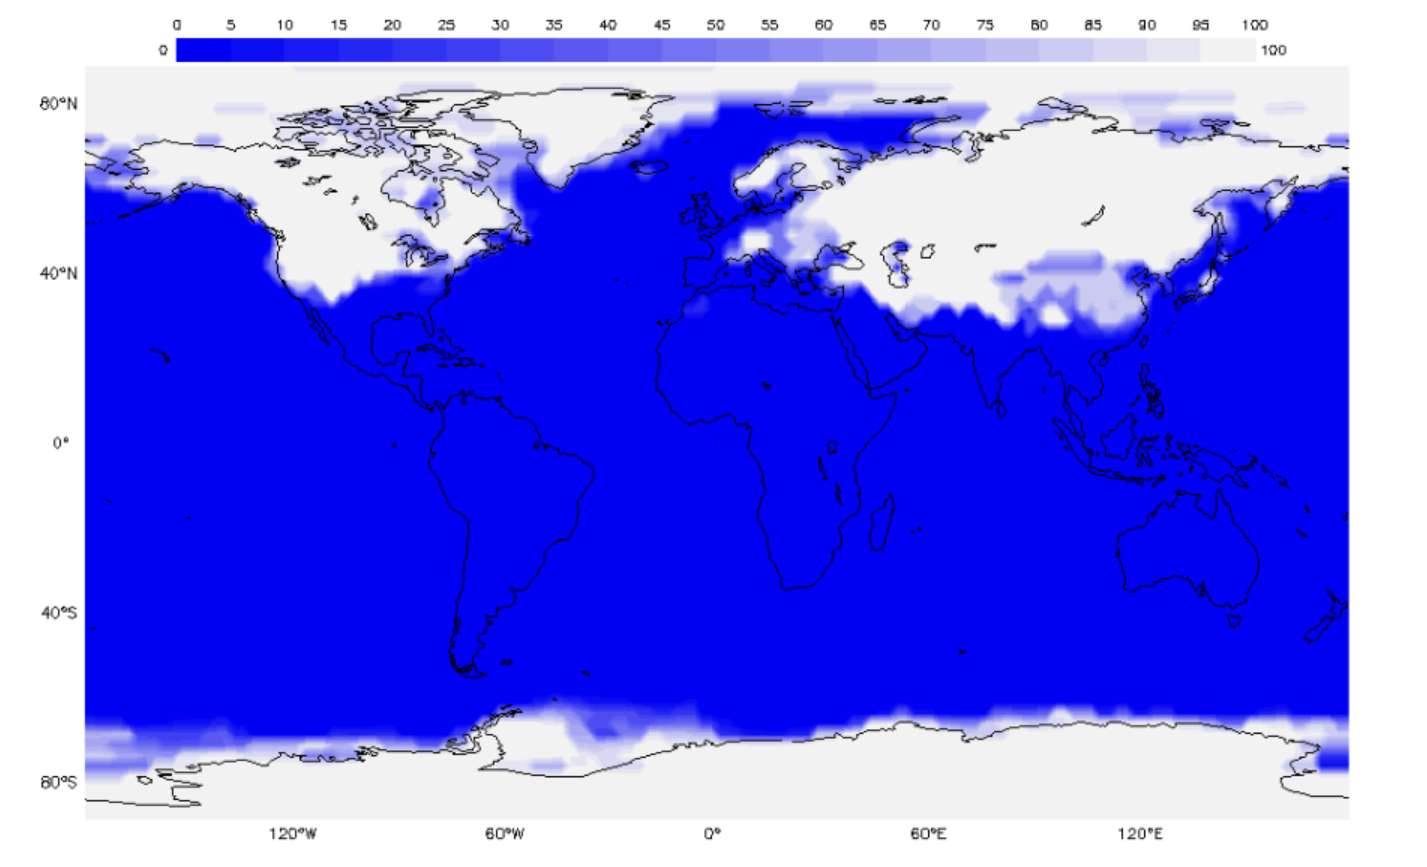
The following maps show two seasonal differences of satellite data for the monthly amount of snow and ice extent in 2017. Observe each map and answer the following questions.
Steps:
- Check with your instructor on how to submit your answers.
- What is the range of values shown on the scale bar?
- Where in the world do you find the highest and lowest extreme values of the data in your images?
- Identify the patterns that you see.
-
Predict what month this plot to represents and give evidence for your prediction.
Now review the second map and identify the changes to answer the following questions.
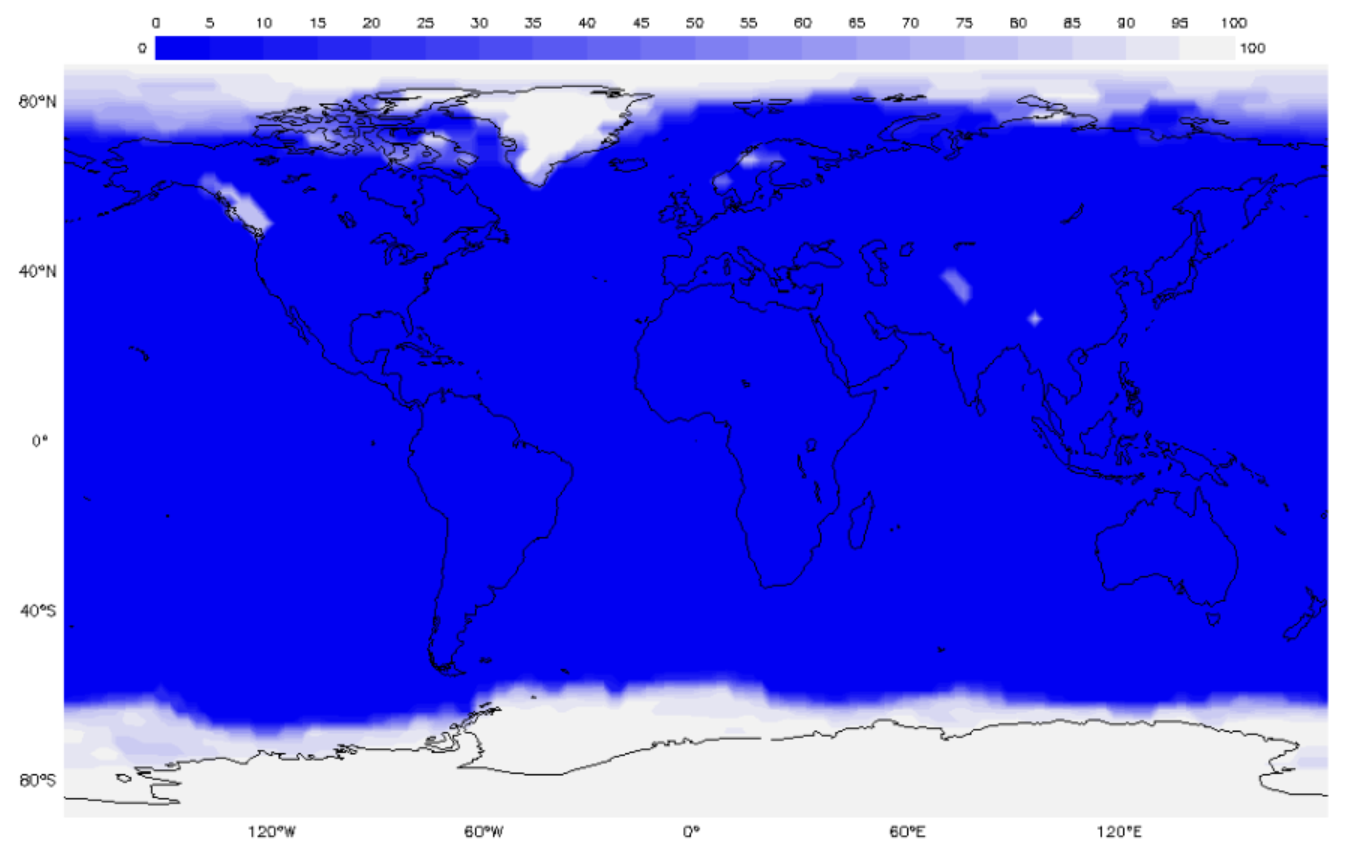
Map 2. Monthly Snow/Ice Percent Coverage. Source: NOAA PMEL | https://mynasadata.larc.nasa.gov/sites/default/files/inline-images/july%2007%20snow%20coverage.png - What changes do you observe?
- Choose a location or region to compare both maps. If there was a change, explain why it happened. What explanations can you suggest for the timing of those extremes?
- Identify and explain why some regions experience both extreme highs and lows and some do not.
- Explain why some regions remain relatively unchanged over the year.
- Predict what month this plot to represents and give evidence for your prediction.

Source:
- LAS UI. (n.d.). My NASA Data. Retrieved October 18, 2022, from https://mynasadata.larc.nasa.gov/EarthSystemLAS/UI.vm#panelHeaderHidden…
Teacher Note
Teachers, these mini lessons/student activities are perfect "warm up" tasks that can be used as a hook, bell ringer, exit slip, etc. They take less than a class period to complete. Learn more on the "My NASA Data What are Mini Lessons?" page.
Teachers who are interested in receiving the answer key, please complete the Teacher Key Request and Verification Form. We verify that requestors are teachers prior to sending access to the answer keys as we’ve had many students try to pass as teachers to gain access.
Disciplinary Core Ideas:
- ESS2A: Earth Materials and Systems
- ESS2D: Weather and Climate
- ESS3A: Natural Resources
Crosscutting Concepts:
- Patterns
- Cause and Effect
- Systems and System Models
Science and Engineering Practices:
- Developing and Using Models
- Analyzing and Interpreting Data
Complementary Mini Lessons
Complementary Lesson Plans

Grade Band
- 6-8
- 9-12
Time
- 30 minutes
Visualization Tool
NGSS Three Dimensional Learning
- See drop-down menu at the bottom of the page