Lesson Plans
Positive Feedback - Arctic Albedo
Overview
Students explore positive feedback effects of changing albedo from melting Arctic sea ice.
Procedure
Seasonal Changes in Albedo
Albedo varies by location and season. This video shows these changes.
View the video: The High Variability of Global Albedo.
Lead a class discussion by asking the following questions. (See teacher key.)
- What is unique about ice and snow? How does their albedo differ?
- How does albedo change with the seasons?
- What does the changing albedo in the polar regions tell you about seasonal changes in ice and snow?
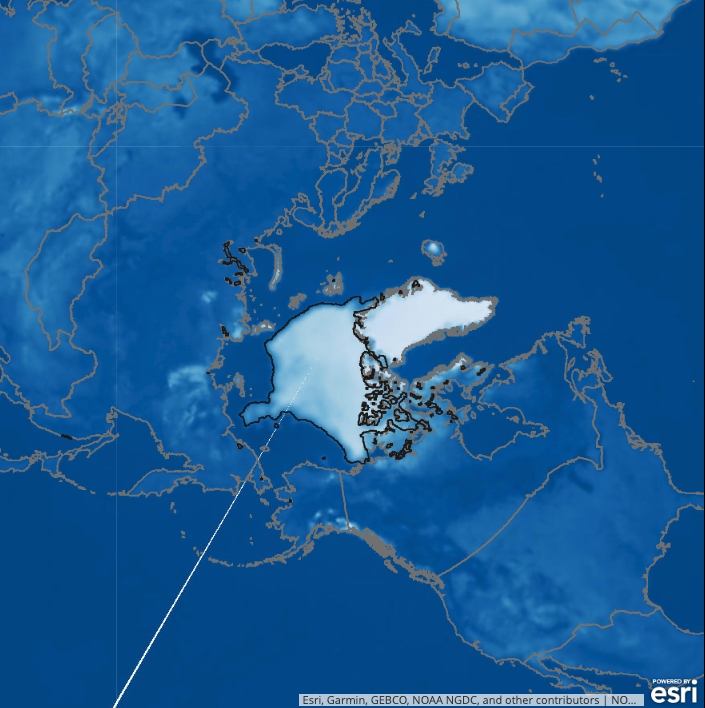
Annual Sea Ice Minimum
We have seen the seasonal changes in albedo. Let's take a closer look at the annual minimum sea ice extent in the Arctic. Watch the NASA 2018 Arctic Sea Ice Ties for Sixth Lowest Minimum Extent on NASA Record(Credit: NASA's Goddard Space Flight Center.)
- What happens to sea ice in the summer? (See teacher key.)
- What trend did you observe in the video? (See teacher key.)
Changes in Sea Ice over Time
We know ice and snow decrease in the polar regions in warmer seasons. However, some snow and ice survive each summer. Watch the video (Disappearing Sea Ice: Credit: NASA Goddard) to see how these decreases have impacted sea ice thickness.
- What reasons can you think of to explain why the older sea ice is disappearing?
Feedbacks
Introduce feedback by showing the NASA video "This World is Black and White" (Credit: NASA/Goddard Space Flight Center). Have students pay close attention to the explanation of negative and positive feedback loops. There are examples of each explained beginning at 2:32 min. in the video.
Have students answer the questions on their student sheets.
- What is a negative feedback loop? Explain the example given in the video. (See teacher key.)
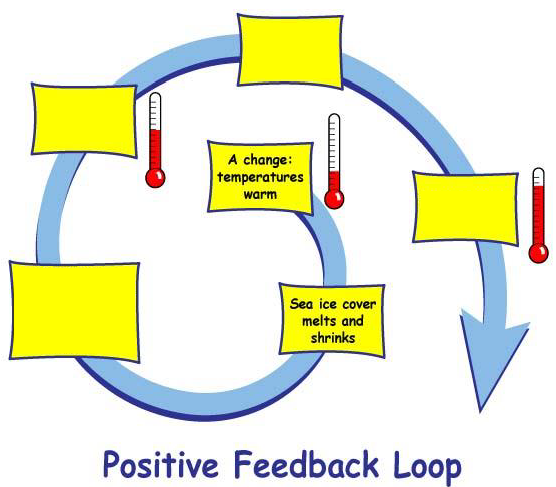
- What is a positive feedback loop? Explain the example given in the video. (See teacher key.)
Based on the information so far, complete the graphic organizer of a positive feedback loop for the effects of changing albedo on sea ice. Teacher note: depending upon the level of your students they can do this independently or during a guided discussion.
Look for Evidence of Changing Albedo
Students will jigsaw to explore and review different representations of Arctic data. First, they will work in groups looking at only one representation of the data in detail. They will then form groups consisting of members who explored the different representations and take turns reviewing each with the group.
-
Students should work in small groups to examine different representations of Arctic data.
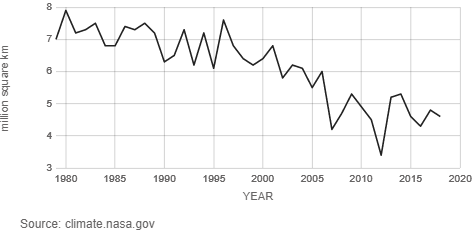
Line graph of annual sea ice minimum over time 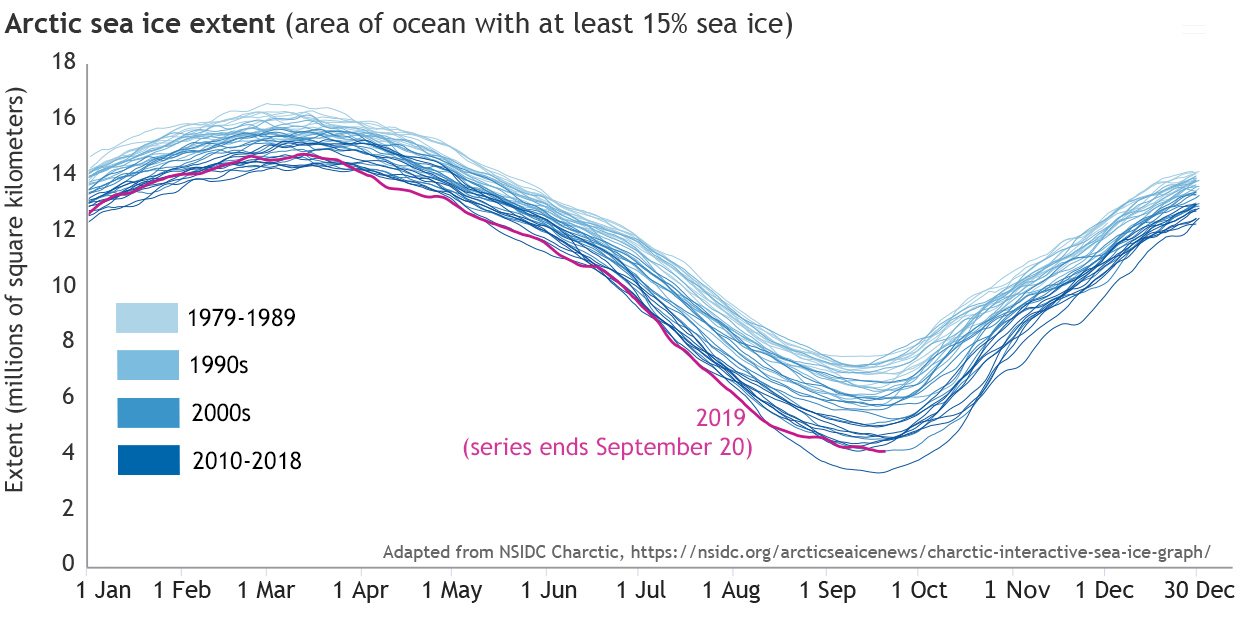
Line graph of daily sea ice extent with different lines for each year 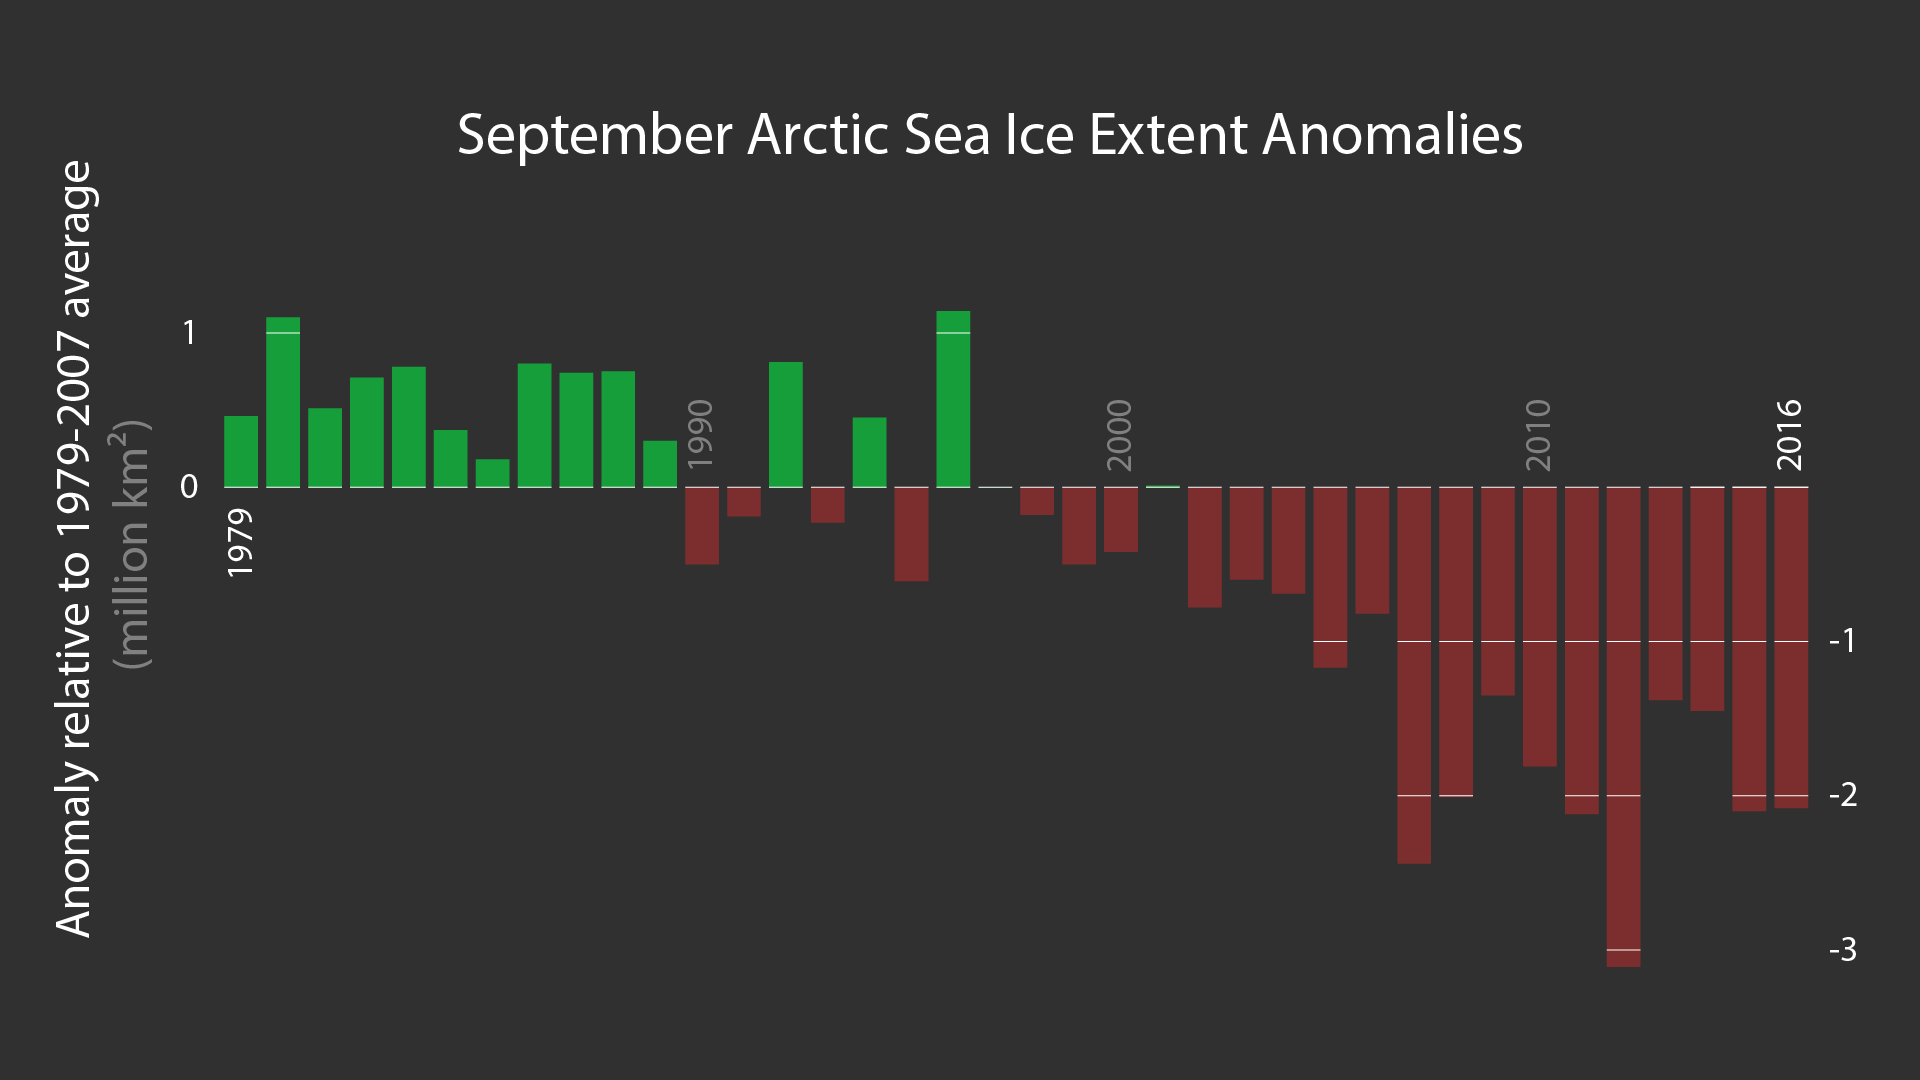
Bar chart showing September Arctic Sea Ice Extent Anomalies 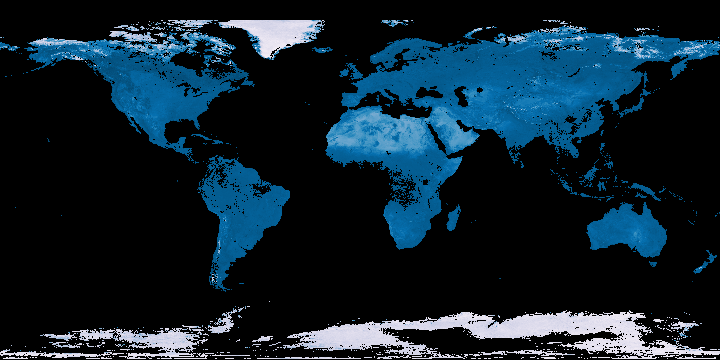
Albedo images showing albedo over land only (This group has 4 images.) - Each group will look at a different representation of data. They will answer the questions for their assigned images. Make sure each student has a copy of their image so they can take them to their new groups and share later.
- Line graph of annual sea ice minimum over time
- Line graph of daily sea ice extent with different lines for each year
- Bar chart showing September Arctic Sea Ice Extent Anomalies - (Remind students that anomalies are the differences from an average or normal.)
- Albedo images showing albedo over land only (This group has 4 images.)
- Form new groups consisting of at least one member of each of the original groups.
- New groups will share their findings with each other to answer the questions for the images they have not looked at yet.
- Each student will complete a Claim-Evidence-Reasoning document.
- They will make a claim for the following prompt: What is likely to happen in the next few years with Arctic sea ice?
- They must support their claim with evidence AND provide the reasoning behind their claim.
- Their reasoning should include the information they have obtained in the lesson.
- Students will turn in their documents for evaluation.
Put it all together
Watch the NASA video Arctic Sea Ice Reaches 2019 Minimum Extent: Credit NASA/Goddard Space Flight Center) which summarizes the information discussed so far.
Exit Ticket
Have students prepare an exit ticket for the following question.
How does a positive feedback loop work?
Disciplinary Core Ideas:
- ESS3D: Global Climate Change
Crosscutting Concepts:
- Cause and Effect
Science and Engineering Practices:
- Engaging in Argument from Evidence
- Students explain a positive feedback loop.
- Students explain the impacts of melting Arctic sea ice on albedo and further ice and snowmelt.
How does melting Arctic sea ice act as a positive feedback?
Earth's Energy Budget
The Earth-Atmosphere system is constantly trying to maintain a balance between the energy that reaches Earth from the sun and the energy that flows from Earth back out to space. If the Earth system is changed either through natural phenomena — such as volcanoes — or man’s activities and an imbalance in the Earth’s energy budget occurs, the Earth’s temperature will eventually increase or decrease in order to restore an energy balance.
Balancing incoming and outgoing energy to Earth is like balancing an equation. When both are equal, Earth’s energy is in balance. Learn more about how changes in this balance may impact Earth. This NASA eClips video, Real World: Earth's Energy Balance - Energy In and Energy Out, explains how Earth's energy budget works.
Ice reflects more sunlight than many other types of surfaces. This has a lot to do with the color of the surface. Have you ever noticed that you get hotter outside in the summer when you wear black and you feel cooler when you wear white? This is the effect of albedo.
Albedo indicates what percentage of the incoming solar radiation (sunlight) is reflected by a surface. The less albedo a surface has, the more energy contained in solar radiation (sunlight) is getting absorbed.
Watch the animation and take note of which surfaces are absorbing and reflecting radiation as sea ice melts.
Sea ice has a much higher albedo compared to other earth surfaces, such as the surrounding ocean. The ocean, for example, reflects only about 6 percent of the incoming solar radiation and absorbs the rest, while sea ice reflects 50 to 70 percent of the incoming energy. Because the sea ice absorbs less solar energy, its surface remains cooler.
If Earth’s climate is colder and there is more snow and ice on the planet, more solar radiation is reflected back out to space and the climate gets even cooler. On the other hand, when warming causes snow and ice to melt, darker colored Earth surface and ocean are exposed and less solar energy is reflected out to space causing even more warming. This is known as the ice-albedo feedback.
The ice-albedo feedback is one of the many mechanisms that influence Earth's energy balance. The overall albedo of the Earth - measured to be 0.30 - has a significant effect on the temperature of the Earth, as it changes how much solar energy is reflected by the Earth as opposed to how much is absorbed. This changes how Earth's energy budget balances, and can have serious impacts on the global climate.
Seasonal Cycles of Sea Ice Extent
Each line on this graph animation represents sea ice extent for that year. Each season, the extent of sea ice follows a similar pattern. During the winter months, Arctic sea ice will reach its maximum extent. This is the peak you see during the month of March. Then, during the month of September, Arctic sea ice reaches its very minimum extent.
This pattern in sea ice extent occurs every year and is largely driven by the seasons. During the winter, the Arctic experiences less incoming solar radiation. This allows the sea ice to accumulate. During the summer months, the Arctic receives far more direct solar radiation. This heats up the air and the ocean, causing the sea ice to melt.
Overall Decline in Sea Ice
There is also a trend that is taking place in the data. After watching the animation several times, you should be able to notice that the line for Arctic sea ice minimum extent has lowered significantly in recent decades. This is largely due to rising global temperatures, and their influence on the ice-albedo feedback.
Arctic Warming
Rising temperatures have a significant impact on Arctic sea ice because they increase the length of the melt season, and decrease the length of the growing season. This means that if this trend continues, the arctic sea ice minimum extent will continue to decrease in size each year during the summer months. Eventually, there will be no more sea ice left in the summer season.
Students should know what albedo is. If they need background information on albedo, show the NASA Climate Bits video below.
This video explains albedo - the concept that the brightness of the Earth system (atmosphere, ocean, land surfaces) determines how much incoming solar energy is immediately reflected back to space. Reflected shortwave energy and land albedo products demonstrate the seasonal and geographic variability of this critical climate process. For more information, visit http://climatebits.org.
Systems are managed by feedback loops, processes where output of the system is fed back or returned to the input. There are positive and negative feedbacks loops that exist in most all systems. Don’t be fooled, however, by the terms positive and negative feedback, which may imply one is good and one is bad. It is actually often the opposite; that the negative feedbacks are what produce balance in the Earth System, whereas the positive feedback loops can act like a runaway train. Positive feedback loops are activities that increase the effects of the interacting parts of the system, while negative feedback loops are activities that decrease the effects of the interacting parts of the system to help maintain equilibrium.
Earth system science is the study of how scientific data stemming from various fields of research, such as the atmosphere, oceans, land ice and others, fit together to form the current picture of our planet as a whole, including its changing climate.
Climate scientists separate factors that affect climate change into three categories: forcings, feedbacks, and tipping points. This lesson focuses on the specific feedback of ice albedo. Other feedbacks are listed below. For additional information on the forcings and tipping points, visit the the NASA webpage The Study of Earth as an Integrated System.
Forcings are the initial drivers of climate, feedbacks can amplify or diminish the effects of climate forcings, and tipping points are when Earth's climate moves abruptly between stable states.
Climate feedbacks: A feedback that increases an initial warming is called a "positive feedback." A feedback that reduces an initial warming is a "negative feedback."
- Clouds. Clouds have an enormous impact on Earth's climate, reflecting about one-third of the total amount of sunlight that hits the Earth's atmosphere back into space. Even small changes in cloud amount, location and type could have large consequences. A warmer climate could cause more water to be held in the atmosphere, leading to an increase in cloudiness and altering the amount of sunlight that reaches the surface of the Earth. Less heat would get absorbed, which could slow the increased warming.
- Precipitation. Global climate models show that precipitation will generally increase due to the increased amount of water held in a warmer atmosphere, but not in all regions. Some regions will dry out instead. Changes in precipitation patterns, such as increased water availability, may cause an increase in plant growth, which in turn could potentially removing more carbon dioxide from the atmosphere.
- Greening of the forests. Natural processes, such as tree growth, remove about half of human carbon dioxide emissions from the atmosphere every year. Scientists are currently studying where this carbon dioxide goes. The delicate balance between the absorption and release of carbon dioxide by the oceans and the world’s great forested regions is the subject of research by many scientists. There is some evidence that the ability of the oceans or forests to continue absorbing carbon dioxide may decline as the world warms, leading to faster accumulation in the atmosphere.
- Ice albedo. Ice is white and very reflective, in contrast to the ocean surface, which is dark and absorbs heat faster. As the atmosphere warms and sea ice melts, the darker ocean absorbs more heat, causes more ice to melt, and makes the Earth warmer overall. The ice-albedo feedback is a very strong positive feedback.
Atmospheric Scientist - Atmospheric scientists study the weather and climate and examine how those conditions affect human activity and the earth in general. Most atmospheric scientists work indoors in weather stations, offices, or laboratories. Occasionally, they do fieldwork, which means working outdoors to examine the weather. Some atmospheric scientists may have to work extended hours during weather emergencies.
Data Visualization - At the core of scientific visualization is the representation of data graphically - through images, animations, and videos - to improve understanding and develop insight. Data visualizers develop data-driven images, maps, and visualizations from information collected by Earth-observing satellites, airborne missions, and ground measurements. Visualizations allow us to explore data, phenomena and behavior; they are particularly effective for showing large scales of time and space, and "invisible" processes (e.g. flows of energy and matter) as integral parts of the models.
Glaciologist - Glaciology is the study of snow and ice. A glaciologist is one who studies and analyzes the movement and physical properties of glaciers and ice. Glaciologists research characteristics of the Cryosphere that include formation, movement, and effects of other parts of the Earth System. A characteristic of their research is to analyze how glaciers and ice caps move and change due to climate change and how those changes influence the climate and surrounding environment.
Model Analyst - A model analyst develops models to help visualize, observe, and predict complicated data. Model analysis is the process of taking large amounts of data and separate it into a structure that makes it intelligible to the binary process of computers. An analyst also manages the flow of information between different user groups through the use of relational databases.
- Internet Required
- Teacher computer/projector only
Complementary Lesson Plans
Complementary Interactives


Grade Band
- 6-8
- 9-12
Time
- 90 minutes
Visualization Tool
NGSS Three Dimensional Learning
- See drop-down menu at the bottom of the page