Lesson Plans
Changing Albedo Lab
Overview
Students develop and test a hypothesis about how albedo affects temperature. This lesson is modeled after the NASA Global Precipitation Measurement Mission's "Heating Earth's Surfaces: Albedo activity."
Materials Required
For each group:
- Thermometers (3 per group)
- Lamps (3 per group) with heat (incandescent) bulb and stand if necessary
- Containers to hold materials
- Stopwatch
- Dark potting soil
- Sugar (to simulate snow)
- Water with blue and/or green food coloring added to make it look like ocean water
For each student:
- Graph paper
- Colored pencils
- Student data sheets
Procedure
This activity can be done as a class demonstration, in groups, as a center, or station in a rotation of activities of similar duration. An option if you have a limited number of lamps is to have each group do a different material and share their results with each other prior to graphing their measurements.
Assess prior knowledge.
- Ask students what it feels like to walk on blacktop barefoot on a hot day.
- Ask students how the grass would feel different on the same day.
- Review albedo with students and explain that the blacktop feels hotter because it has a lower albedo and absorbs more of the energy from the Sun. This is the same reason a black shirt feels hotter on a hot day than a white shirt. The white shirt has a high albedo. If students need background information on albedo, show the video in the Prerequisite Student Knowledge section.
Introduce the activity.
- In this activity, we are using different materials for different surfaces on Earth, soil, water and snow.
- Students will complete the student sheets for the investigation.
- We are using sugar to model the snow. What characteristic is the same for snow and sugar? (color)
- What would the soil represent? (land)
- What does the water represent? (lakes, oceans, rivers)
Investigate the phenomenon by creating a model.
- Fill each container with approximately 4 cm of the materials (potting soil, sugar, water).
- Place the containers under the lights. Make sure they each are receiving light from the same angle and the same height above the container. Do not turn the lamps on yet.
- Place a thermometer in each container making sure it is the same depth in each container.
- Have students prepare their data collection sheets by recording the temperature before they turn on the lamp. This should be at time 0.
- Turn the lamps on and start the stopwatch at the same time.
- Record the temperatures every minute for 10 minutes.
- Have students graph the results.
- Use a different colored pencil for each material.
- Label the axes.
- Include a title.
- Include a caption.
Apply the model to the Earth System.
Depending upon the level of your students, either have them complete the questions independently or discuss albedo in the Arctic.
- As the temperatures rise with the seasons, what happens to sea ice? (It begins to melt.)
- What do you think happens to the ice in the Arctic when the Sun shines on it? (It reflects a lot of the sunlight and doesn't warm as much as land would.)
- As ice and snow begin to melt, what will form? (puddles, pools of water, melt into the ocean)
- How will melting ice and snow change the albedo? (The albedo of the puddles will be lower.)
- As the albedo changes from the melting, how will this affect the melting? (With a lower albedo, the surface will absorb more sunlight and warm more causing faster melting.)
Evaluate.
- Have students answer the questions on the student sheets about the experiment.
- Collect and correct the answers.
- Evaluate the graphs the students produced.
Disciplinary Core Ideas:
- ESS2A: Earth Materials and Systems
Crosscutting Concepts:
- Cause and Effect
Science and Engineering Practices:
- Planning and Carrying out Investigations
- Students will develop a hypothesis about how albedo affects temperature.
- Students will identify the independent and dependent variables for their investigation.
- Students will test their hypothesis.
- Students will explain that snow and ice have a higher albedo than water.
- Students will explain that as ice and snow melt, the albedo changes.
- Students will predict the impact of changing albedo in the Arctic and Antarctic.
- What is you hypothesis about how albedo affects temperature?
- What is the effect of the difference in albedo between light colors and dark colors?
- What is the impact of melting snow and ice on albedo?
- What is the effect of the melting snow and ice?
Earth's Energy Budget
The Earth-Atmosphere system is constantly trying to maintain a balance between the energy that reaches Earth from the sun and the energy that flows from Earth back out to space. If the Earth system is changed either through natural phenomena — such as volcanoes — or man’s activities and an imbalance in the Earth’s energy budget occurs, the Earth’s temperature will eventually increase or decrease in order to restore an energy balance.
Balancing incoming and outgoing energy to Earth is like balancing an equation. When both are equal, Earth’s energy is in balance. Learn more about how changes in this balance may impact Earth. This NASA eClips video, Real World: Earth's Energy Balance - Energy In and Energy Out, explains how Earth's energy budget works.
Ice reflects more sunlight than many other types of surfaces. This has a lot to do with the color of the surface. Have you ever noticed that you get hotter outside in the summer when you wear black and you feel cooler when you wear white? This is the effect of albedo.
Albedo indicates what percentage of the incoming solar radiation (sunlight) is reflected by a surface. The less albedo a surface has, the more energy contained in solar radiation (sunlight) is getting absorbed.
Typical Albedo values:
- Sea Ice 0.50 - 0.70
- Fresh Snow 0.80 - 0.90
- Ocean Water ~ 0.06
- Dark Soil - 0.10 - 0.20
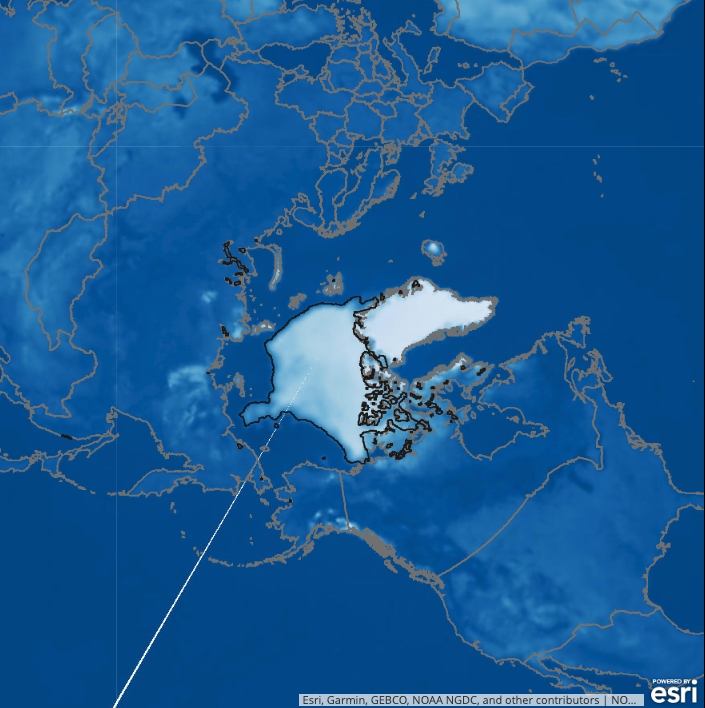
Watch the animation and take note of which surfaces are absorbing and reflecting radiation as sea ice melts.
Sea ice has a much higher albedo compared to other earth surfaces, such as the surrounding ocean. The ocean, for example, reflects only about 6 percent of the incoming solar radiation and absorbs the rest, while sea ice reflects 50 to 70 percent of the incoming energy. Because the sea ice absorbs less solar energy, its surface remains cooler.
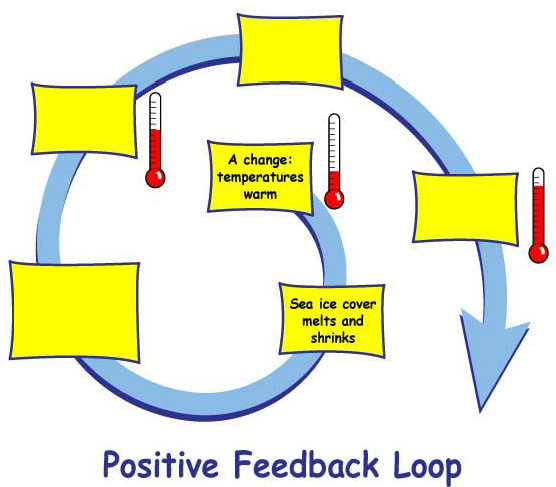
If Earth’s climate is colder and there is more snow and ice on the planet, more solar radiation is reflected back out to space and the climate gets even cooler. On the other hand, when warming causes snow and ice to melt, darker colored Earth surface and ocean are exposed and less solar energy is reflected out to space causing even more warming. This is known as the ice-albedo feedback.
The ice-albedo feedback is one of the many mechanisms that influence Earth's energy balance. The overall albedo of the Earth - measured to be 0.30 - has a significant effect on the temperature of the Earth, as it changes how much solar energy is reflected by the Earth as opposed to how much is absorbed. This changes how Earth's energy budget balances, and can have serious impacts on the global climate.
Seasonal Cycles of Sea Ice Extent
Each line on this graph animation represents the sea ice extent for that year. Each season, the extent of sea ice follows a similar pattern. During the winter months, Arctic sea ice will reach its maximum extent. This is the peak you see during the month of March. Then, during the month of September, Arctic sea ice reaches its very minimum extent.
This pattern in sea ice extent occurs every year and is largely driven by the seasons. During the winter, the Arctic experiences less incoming solar radiation. This allows the sea ice to accumulate. During the summer months, the Arctic receives far more direct solar radiation. This heats up the air and the ocean, causing the sea ice to melt.
Overall Decline in Sea Ice
There is also a trend that is taking place in the data. After watching the animation several times, you should be able to notice that the line for Arctic sea ice minimum extent has lowered significantly in recent decades. This is largely due to rising global temperatures, and their influence on the ice-albedo feedback.
Arctic Warming
Rising temperatures have a significant impact on Arctic sea ice because they increase the length of the melt season, and decrease the length of the growing season. This means that if this trend continues, the arctic sea ice minimum extent will continue to decrease in size each year during the summer months. Eventually, there will be no more sea ice left in the summer season.
Students should be familiar with the concept of albedo. If they need background information on albedo, show the NASA Climate Bits video below.
This video explains albedo - the concept that the brightness of the Earth system (atmosphere, ocean, land surfaces) determines how much incoming solar energy is immediately reflected back to space. Reflected shortwave energy and land albedo products demonstrate the seasonal and geographic variability of this critical climate process. For more information, visit http://climatebits.org.
Students may think that ice and snow have a high albedo because they are cold. It is due to their color not the temperature.
Earth's Energy Budget
Balancing incoming and outgoing energy to Earth is like balancing an equation. When both are equal, Earth’s energy is in balance. Learn more about how changes in this balance may impact Earth. This NASA eClips video, Real World: Earth's Energy Balance - Energy In and Energy Out, explains how Earth's energy budget works.
Atmospheric Scientist - Atmospheric scientists study the weather and climate and examine how those conditions affect human activity and the earth in general. Most atmospheric scientists work indoors in weather stations, offices, or laboratories. Occasionally, they do fieldwork, which means working outdoors to examine the weather. Some atmospheric scientists may have to work extended hours during weather emergencies.
Data Visualization - At the core of scientific visualization is the representation of data graphically - through images, animations, and videos - to improve understanding and develop insight. Data visualizers develop data-driven images, maps, and visualizations from information collected by Earth-observing satellites, airborne missions, and ground measurements. Visualizations allow us to explore data, phenomena and behavior; they are particularly effective for showing large scales of time and space, and "invisible" processes (e.g. flows of energy and matter) as integral parts of the models.
Glaciologist - Glaciology is the study of snow and ice. A glaciologist is one who studies and analyzes the movement and physical properties of glaciers and ice. Glaciologists research characteristics of the Cryosphere that include formation, movement, and effects of other parts of the Earth System. A characteristic of their research is to analyze how glaciers and ice caps move and change due to climate change and how those changes influence the climate and surrounding environment.
Model Analyst - A model analyst develops models to help visualize, observe, and predict complicated data. Model analysis is the process of taking large amounts of data and separate it into a structure that makes it intelligible to the binary process of computers. An analyst also manages the flow of information between different user groups through the use of relational databases.
- Brainstorm different materials that can be used.
- After 10 minutes with the lamps on, turn them off and continue measuring for 10 more minutes to see if there is any cooling.
- Standalone Lesson (no technology required)
Complementary Lesson Plans


Grade Band
- 6-8
- 9-12
Time
- 90 minutes
Visualization Tool
NGSS Three Dimensional Learning
- See drop-down menu at the bottom of the page