Mini Lesson/Activity
Explore Albedo Values: Student Activity
Overview
Students will use the NASA Earth Observations analysis tool to explore changing albedo in the Arctic compared with other areas of Earth.
Student Directions
- Introduce or review the concept of albedo with students by showing the NASA Climate Bits: Albedo video.
- After watching the video, have students go to the NASA Earth Observations Website (https://neo.sci.gsfc.nasa.gov/). They will select three months of albedo data and use the data probe tool to explore the albedo values in the Arctic region.
-
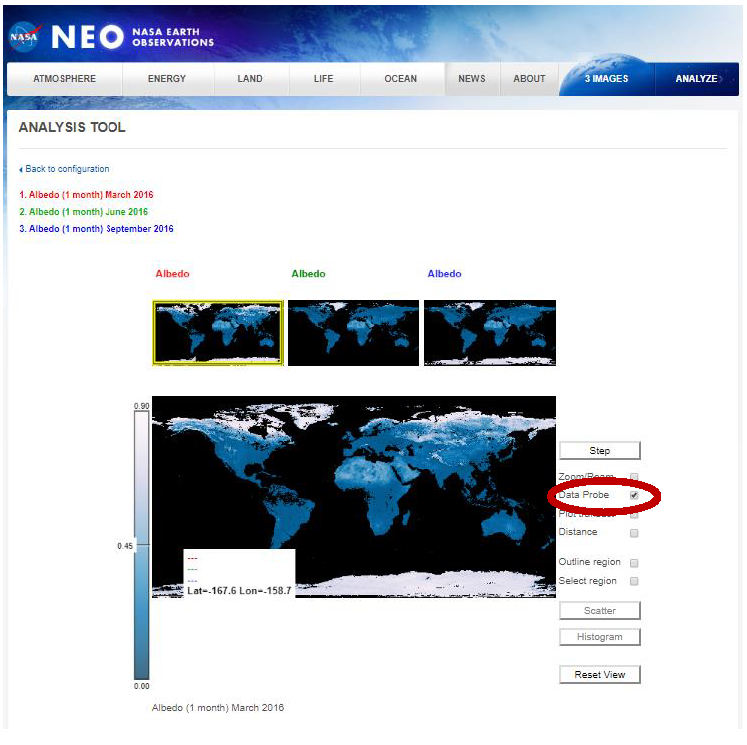
The first screen will look like this.
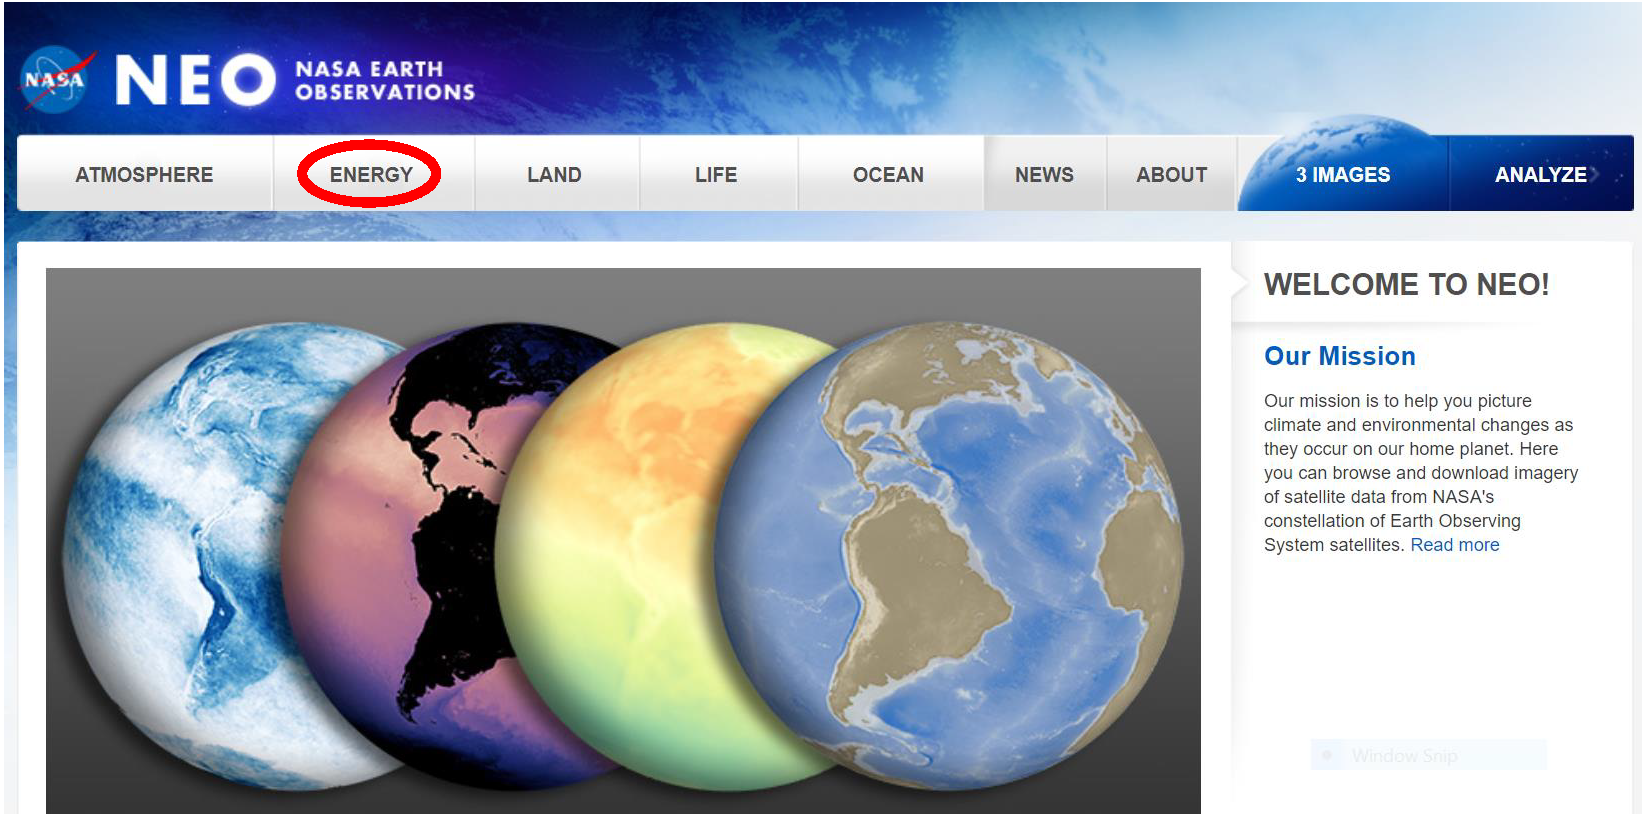
Credit: NASA Earth Observations 4. Have the students click on Energy at the top of the screen as indicated by the red oval in the image above.
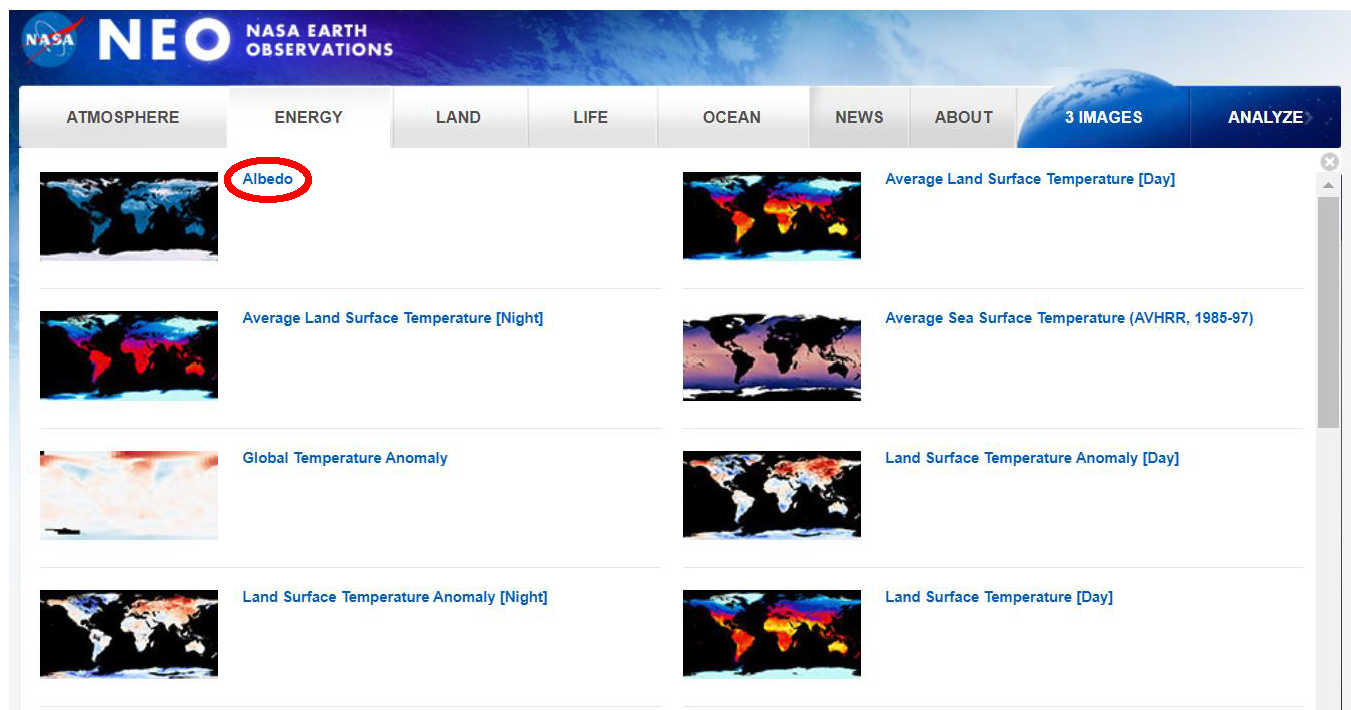
5. Students will then click on Albedo.
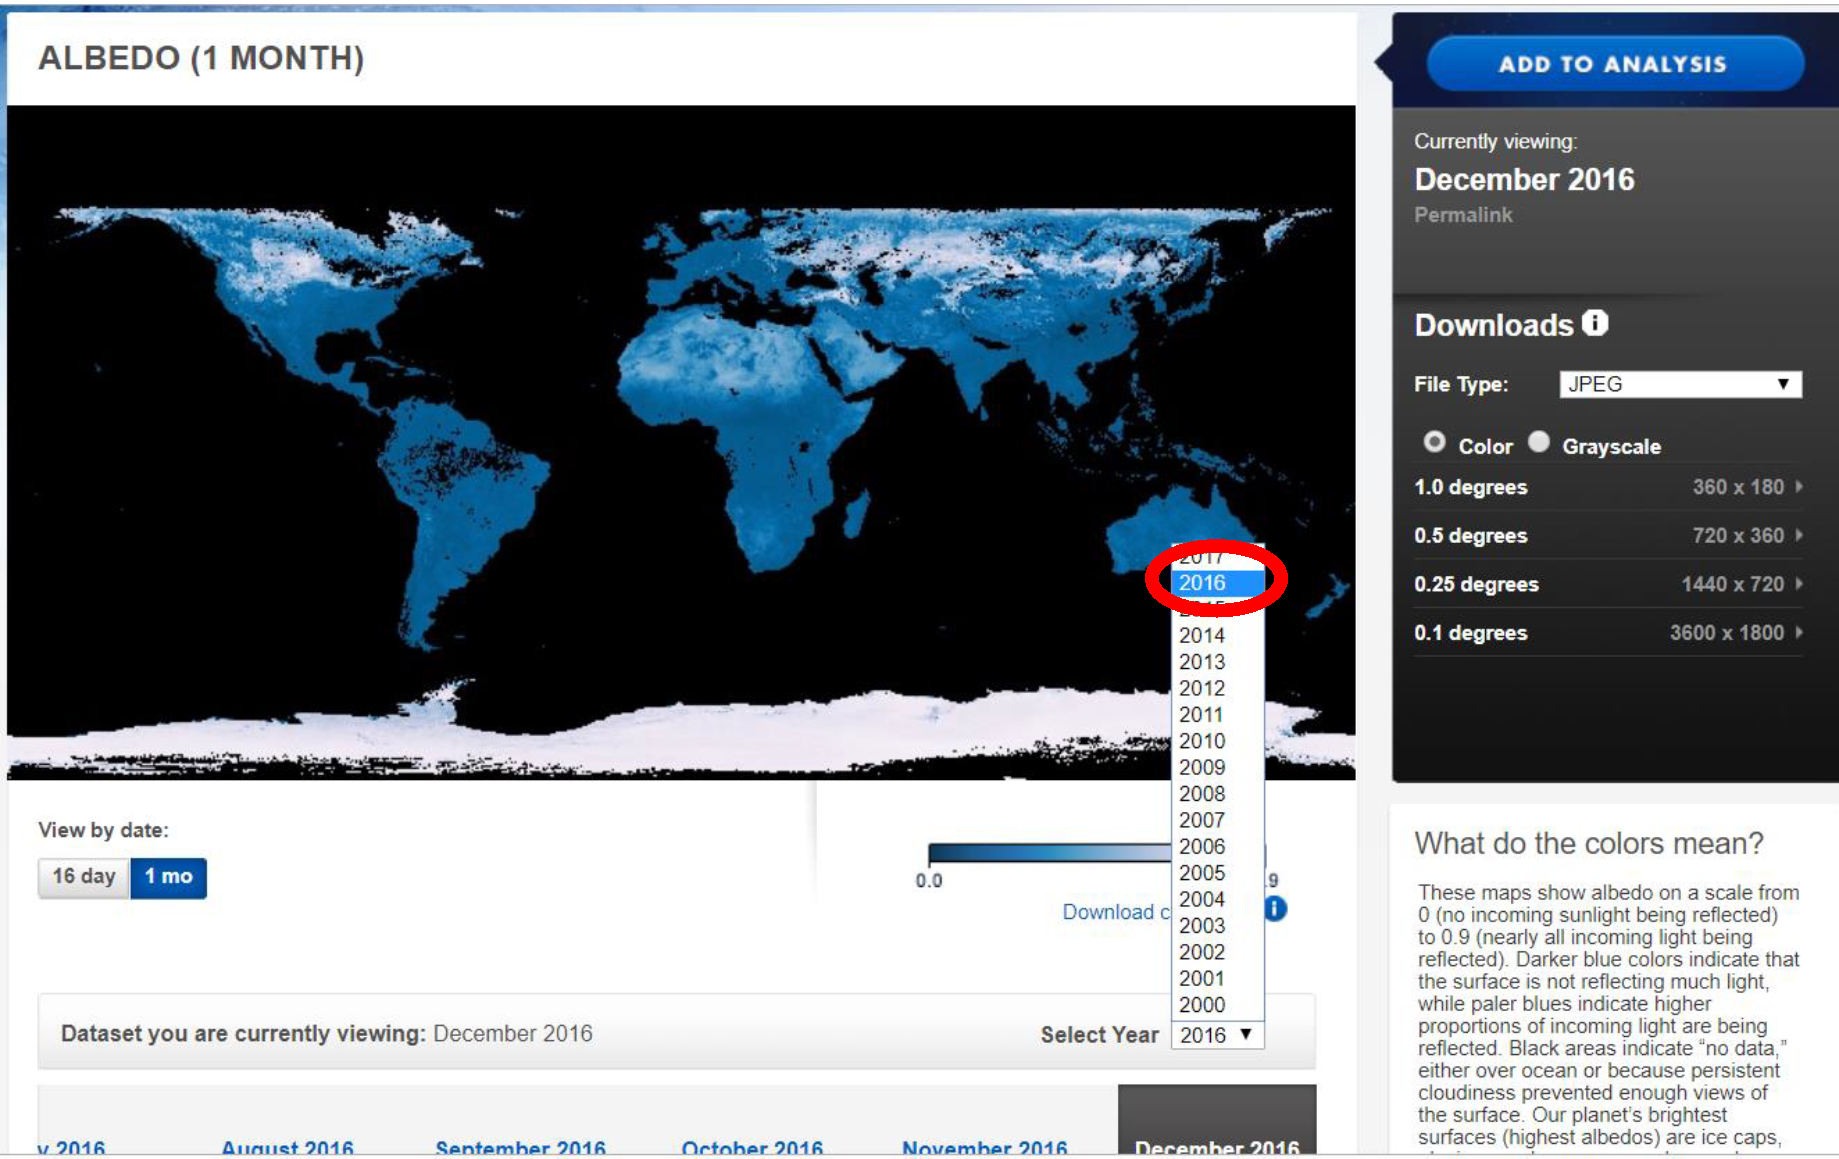
6. When the albedo screen comes up, students should select the dropdown for the year and click on 2016.
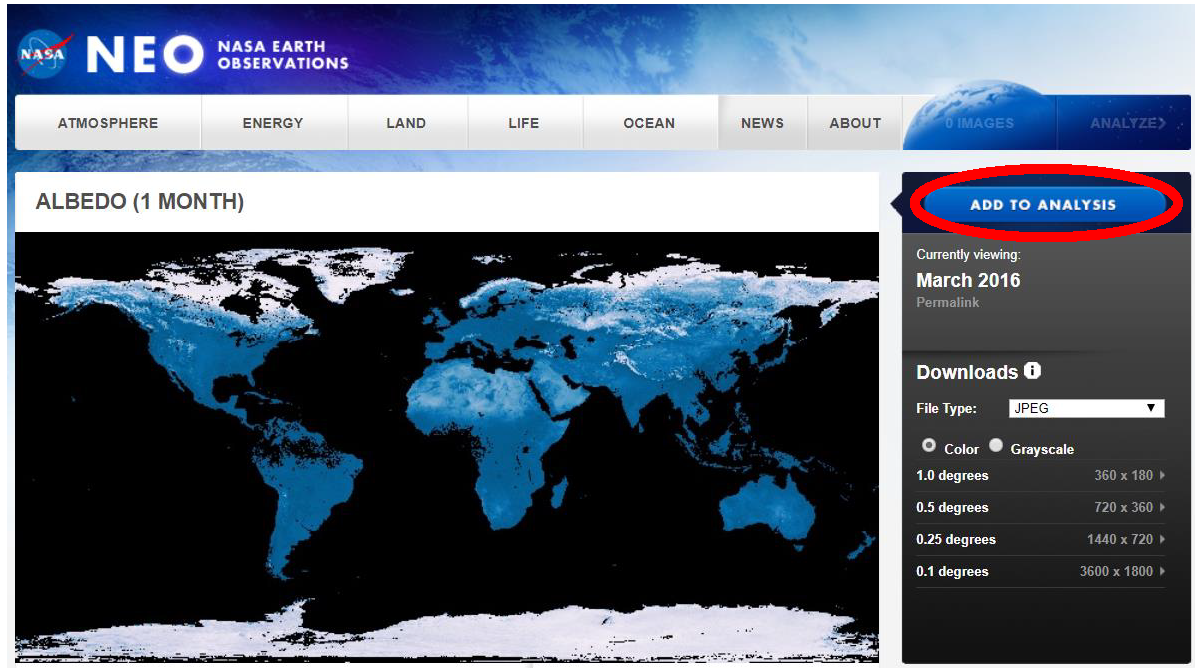
7. On the next screen, they will slide the date bar to the left and click on the words March 2016.
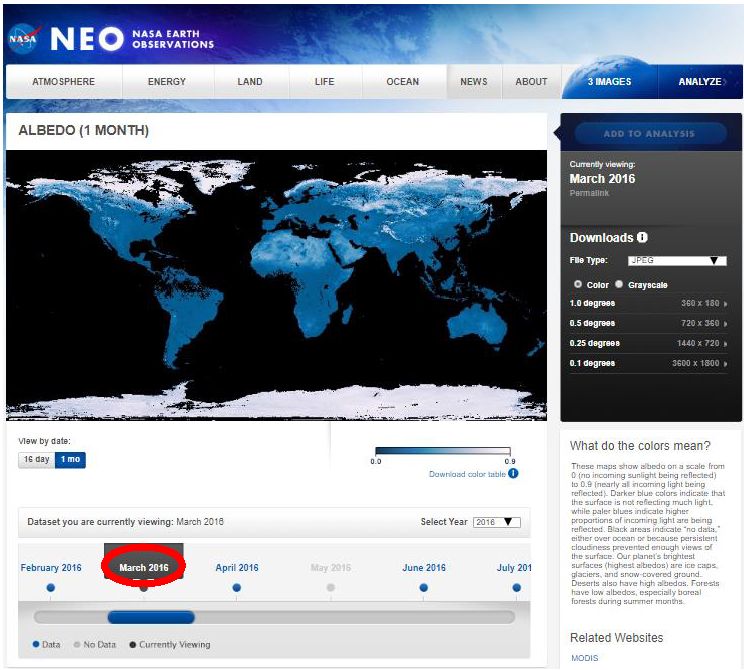
8. After the March 2016 image is displayed, click on Add to Analysis at the top right of the screen.
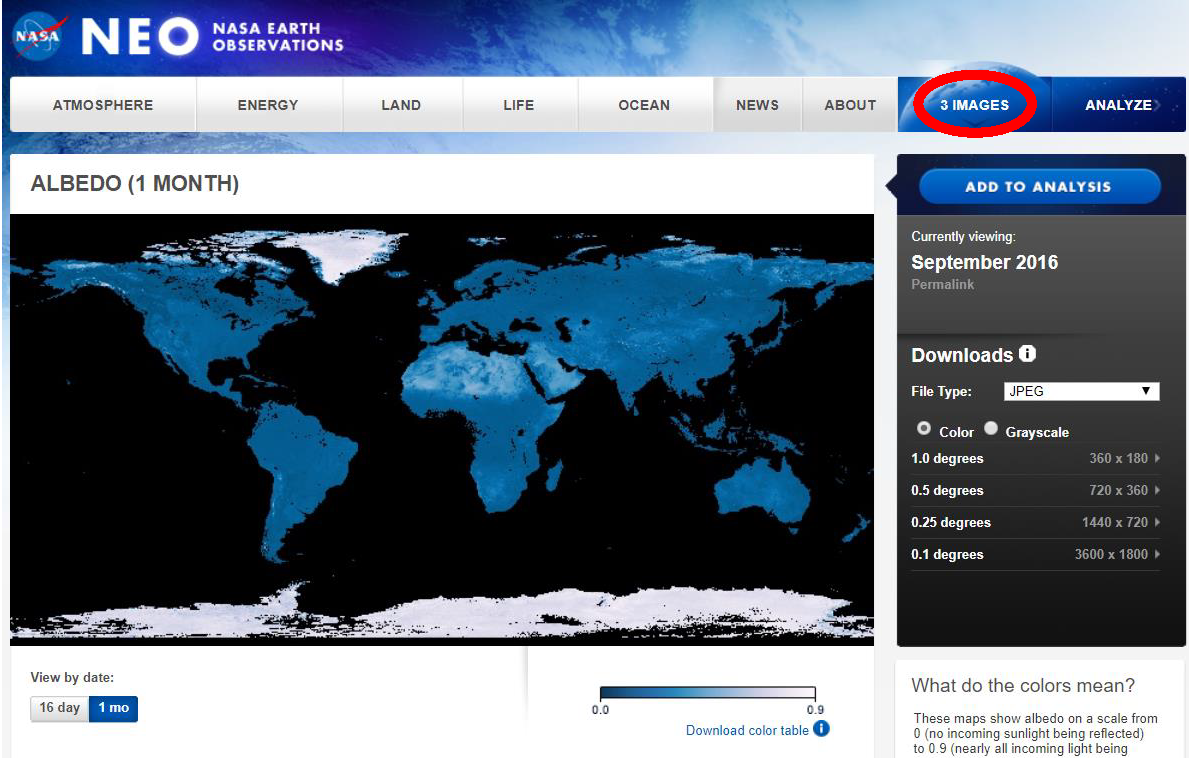
9. Follow the same steps to select June 2016 and September 2016. Once the three images are added, students should see that there are three images selected.
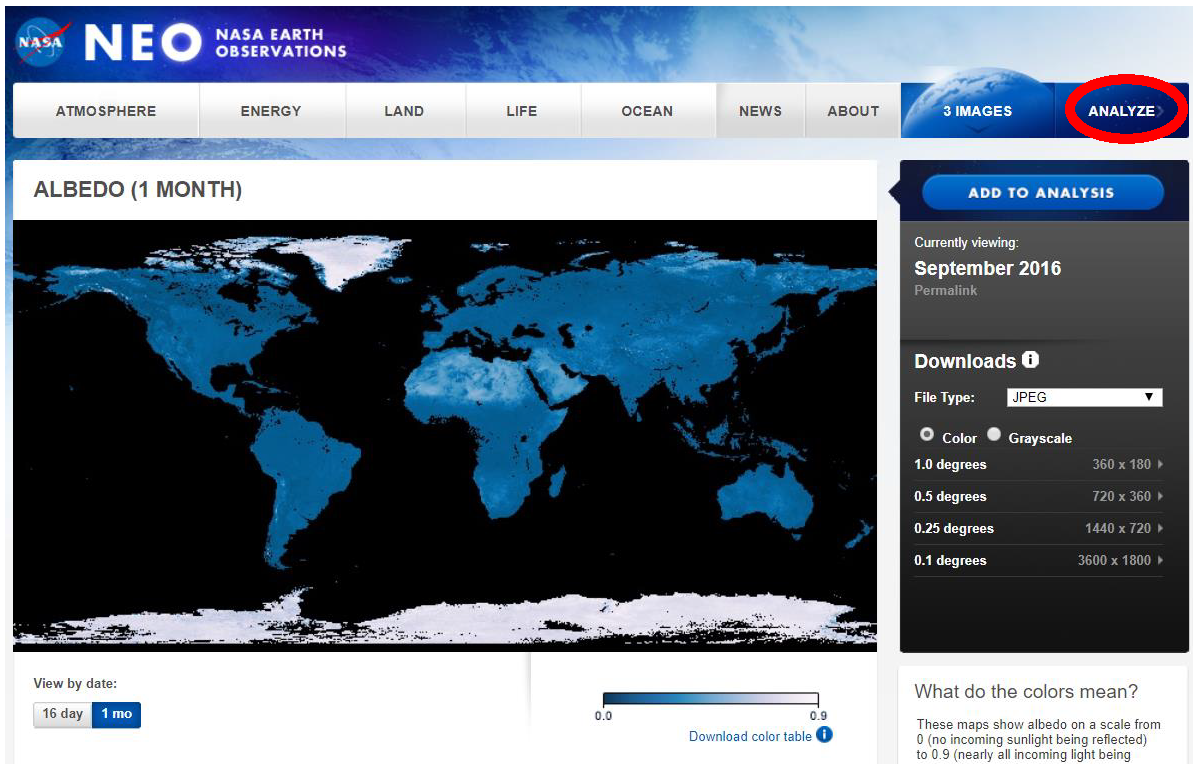
10. Have students click on the Analyze button at the top right of the screen.
11. On the next screen, students should verify that the mode is basic exploration and the file size is 0.25 degrees. Then they should click on Launch Analysis.
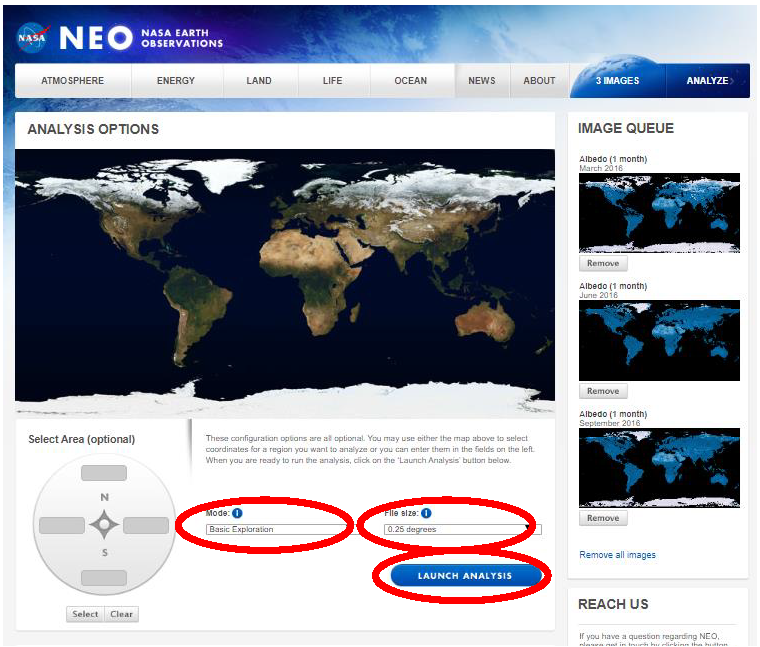
12. When the analysis screen appears, point out to students that the three months are indicated by different colors. Have students click on Data Probe. They will be able to move the cursor over different locations and see the albedo values for all three months in their respective colors.
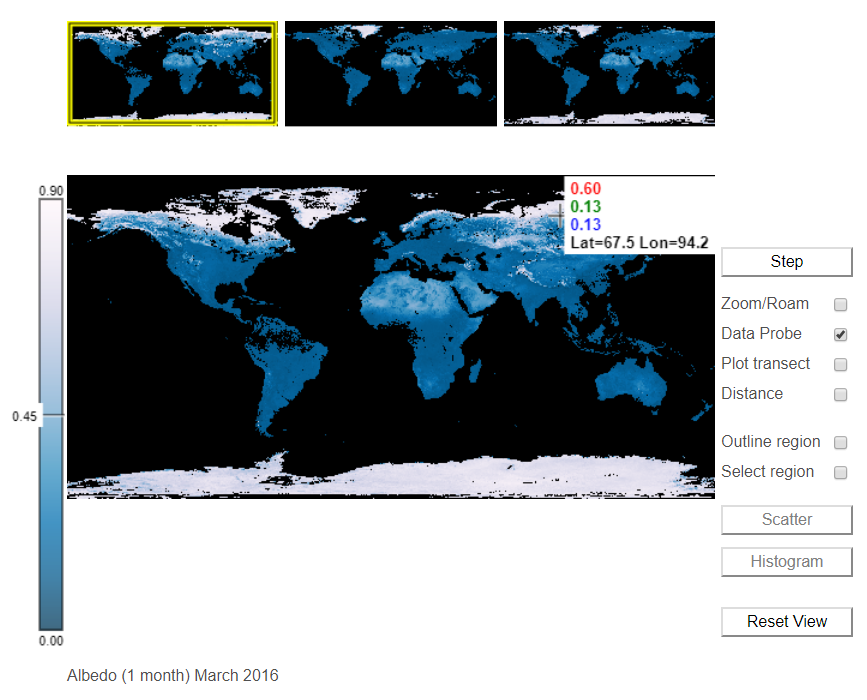
13. Let students explore for a few minutes and then have them answer the following questions.
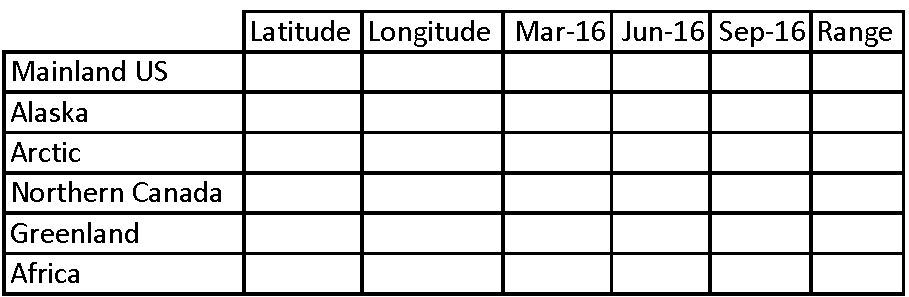
- Fill in the table with the data you collect.
- After filling in the data, calculate the range for each location by subtracting the lowest albedo value from the highest albedo value.
- Which locations have the lowest range?
- Which locations have the highest range?
- Areas with a higher range experience more change in albedo during the year. What do these areas have in common?
- Why do you think these areas experience changing albedo?
Teacher Note
Students will use the NASA Earth Observations analysis tool to explore changing albedo in the Arctic compared with other areas of Earth. Students should notice that the northernmost areas experience a greater variation. These are areas that have cycles of ice growth and melt throughout the seasons.
Ice has a high albedo. As it melts, the albedo decreases. This leads to changes in albedo in the Arctic as the seasons change. Areas over land such as Africa and the mainland US experience less change because the reflectivity of the land does not change as much as the melting ice.
Supported NGSS Performance Expectations
- MS-ESS3-1: Construct a scientific explanation based on evidence for how the uneven distributions of Earth's mineral, energy, and groundwater resources are the result of past and current geoscience processes.
- HS-ESS3-5: Analyze geoscience data and the results from global climate models to make an evidence-based forecast of the current rate of global or regional climate change and associated future impacts to Earth's systems.


Document Resources
Grade Band
- 6-8
- 9-12
Time
- 50 minutes