Ice, which covers 10 percent of Earth's surface, is disappearing rapidly. While the Arctic sea ice extent is declining, air temperatures are rising. Vegetation is changing, with tundra being replaced by shrubs. Permafrost is warming and thawing over parts of the Arctic. Some of these changes, such as the replacement of white reflective sea ice with dark open water, set in motion feedbacks that contribute to even further warming. As the Arctic warms, some animal species are finding the region more hospitable, while others are seeing declines in their habitat. The recent changes in the Arctic region have important impacts for regions outside of the Arctic and for the global climate.
>> Read More >>
Just one moment,
loading Cryosphere...
Featured Interactives
-
-
Grade Level: 6-8, 9-12
Using various visualizations (i.e., images, charts, and graphs), students will explore changes in sea ice extent as it relates to other spheres within the Earth System. This StoryMap is intended to be used with students who have access to the internet in a 1:1 or 1:2 setting.
Grade Level: 3-5, 6-8
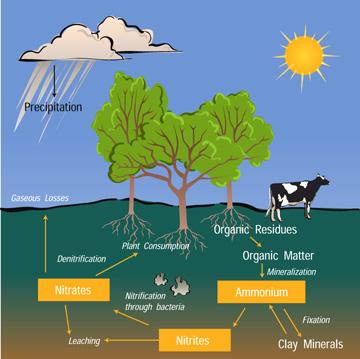
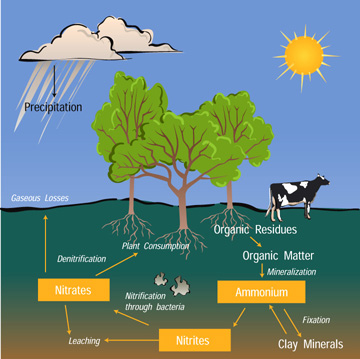
Students will explore the Nitrogen Cycle by modeling the movement of a nitrogen atom as it passes through the cycle. Students will stop in the different reservoirs along the way, answering questions about the processes that brought them to the different reservoirs.
Previous
Next
Grade Level: 6-8,
9-12
Using various visualizations (i.e., images, charts, and graphs), students will explore changes in sea ice extent as it relates to other spheres within the Earth System. This StoryMap is intended to be used with students who have access to the internet in a 1:1 or 1:2 setting.
Grade Level: 3-5,
6-8
Students will explore the Nitrogen Cycle by modeling the movement of a nitrogen atom as it passes through the cycle. Students will stop in the different reservoirs along the way, answering questions about the processes that brought them to the different reservoirs.
Snow and Ice Extent landing page. Explore maps, graphs, data, and related education resources. These resources include lesson plans, mini lessons, activities, and datasets for teachers and students.


