Mini Lesson/Activity
Evaluating Plants as Energy Stores
Overview
Students learn how to estimate the "energy efficiency" of photosynthesis, or the amount of energy that plants absorb for any given location on Earth. This is the ratio of the amount of energy stored to the amount of light energy absorbed and is used to evaluate and model photosynthesis efficiency.
Student Directions
Plants capture and store solar energy through photosynthesis. During photosynthesis, living plants convert carbon dioxide in the air into sugar molecules they use for food. In the process of making their own food, plants also provide the oxygen we need to breathe. Thus, plants provide the energy and air required by most life forms on Earth. There are other factors that affect the growth of plants, too. These include the presence of enough carbon dioxide, freshwater, nutrients, and warm temperatures.

Did you know that you can estimate the amount of energy that the plants absorb for any given location on Earth using NASA data? We call that the "energy efficiency" of photosynthesis. This is the ratio of the amount of energy stored to the amount of light energy absorbed.
You can use these data to evaluate and model photosynthesis efficiency.
Formula:
Energy taken in by plants per second, per square meter of plants = Flux (flow of energy) * Leaf Area Index* Photosynthesis efficiency
Check out this example:
- Flux (flow of energy) = 95 W/m^2
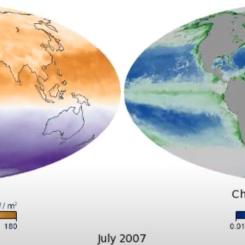
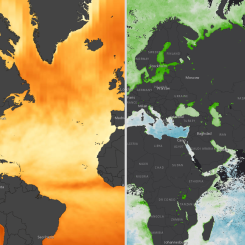
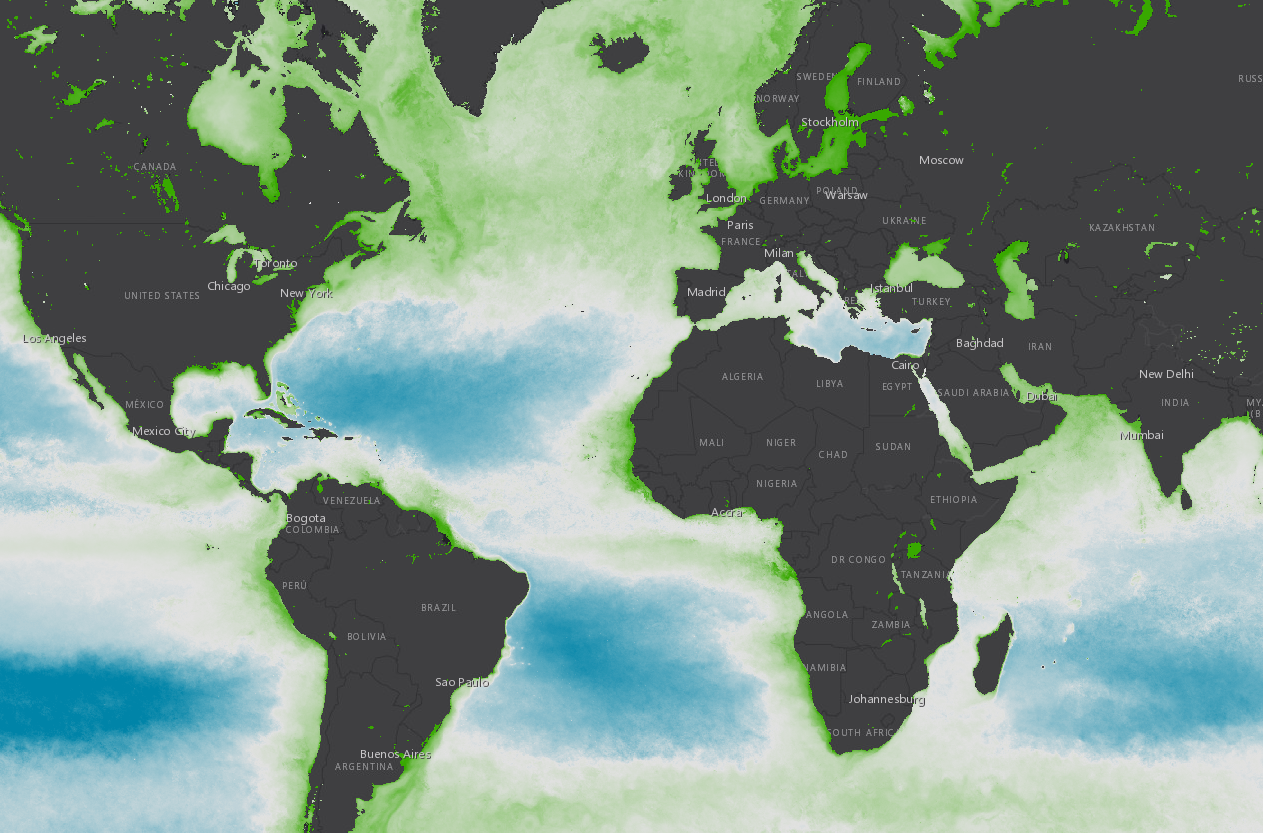
- This quantity describes the total flow of energy from the Atmosphere to the surface by shortwave radiation, which is the visible light coming from the Sun. This is the flow of energy that warms the Earth's surface during the daytime. Clouds affect the rate of this energy flow, and the rate also varies with the seasons (higher rate in summer and lower rate in winter). These data have a grid spacing of 1 degree longitude and 1 degree latitude.
- UNITS: The units of these data are Watts per square meter, which is the flow of energy spread out over an area. Five Watts per square meter is equivalent to the power used by a standard charger (5 Watts) passing through a square piece of paper with length and width of 1 meter.
- Leaf Area Index (unitless value)= 0.86
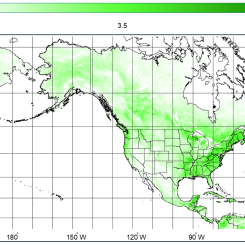
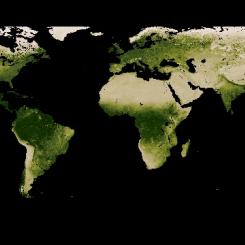
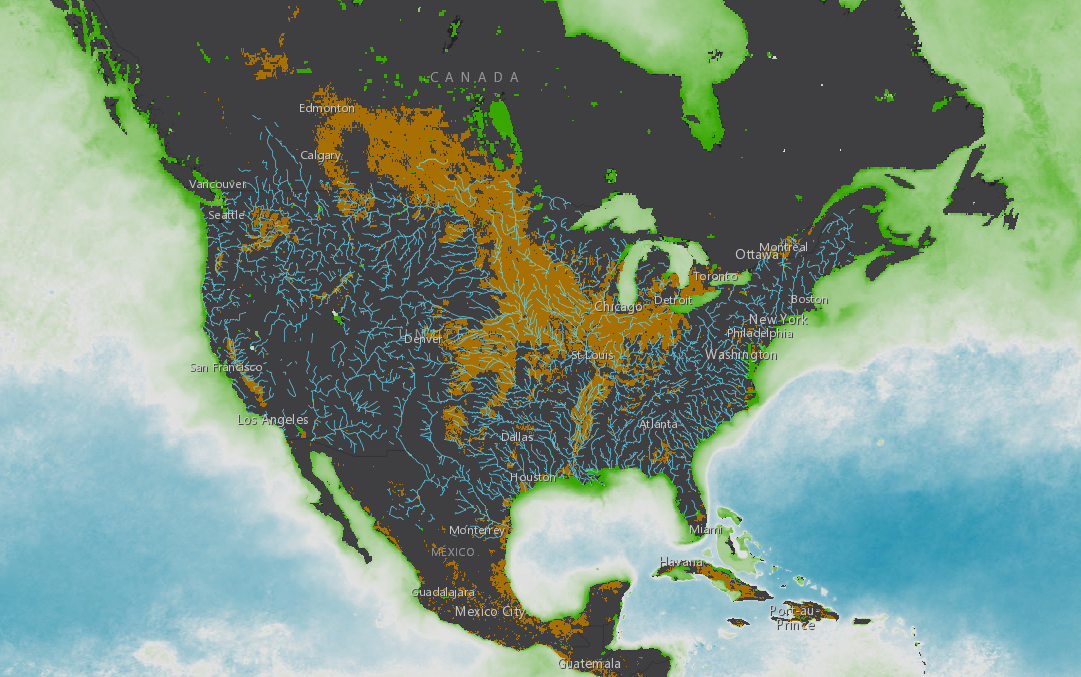
- This quantity measures the amount of leaves present at each location on the map relative to the total land area at that location. Values less than one mean that part of the location covered with leafy plants. Values greater than one mean that the location is covered with several layers of leaves, as in a forest canopy. The leaf area index is directly related to the health and primary productivity of plants, as plants are more productive with more leaves. These data have a grid spacing of 0.5 degrees longitude and 0.5 degrees latitude.
- UNITS: The leaf area index is a ratio, so it has no units (dimensionless).
- Photosynthesis Efficiency = 0.046 (value estimated by scientists for a typical plant)
Energy taken in by plants per second, per square meter of ground covered by plants = 95 (W/m^2) * 0.86 * 0.046 = 3.76 W for every square meter of ground.
This means that a plant that covers 1 square meter of ground gets 3.76 J of energy every second from photosynthesis. For reference, most cell phone chargers use about 5 J or energy every second (5 W).
Let's compare data values for a sample location - Bangor, Maine (68.78 west, 44.83 north). This city is a former timber hub and enjoys quick access to miles of forests, trails, beaver, and deer. In which month do you predict the most energy will be taken in by plants? Why?
Below is a data table prefilled with key satellite data collected at this location to help you calculate the amount of energy plants took in over key months in 2019. Complete the calculations for Cells 1-4 using these data and answer the following questions.
Steps:
1. Check with your instructor on how to submit your answers.
| DATE | Monthly Average Shortwave Energy Flow (Watts/m^2) | Monthly Leaf Area Index | Photosynthesis Efficiency = 0.046 (value estimated by scientists for a typical plant) |
Energy Taken in By Plants (W for every square meter of ground) |
| Apr-2019 | 160.027 | 0.697028 | 0.046 | 1. |
| Jul-2019 | 276.433 | 2.49856 | 0.046 | 2. |
| Sep-2019 | 178.14 | 1.72661 | 0.046 | 3. |
| Dec-2019 | 53.6093 | 0.622693 | 0.046 | 4. |
2. In which month did the plants take in the most energy? The least energy? Explain how the variables of Energy Flow and Monthly Leaf Area Index impacted these data values.
3. How might the type of plants surveyed affect the efficiency rate? For example, how would a deciduous forest compare to a coniferous forest at the same latitude?
Source:
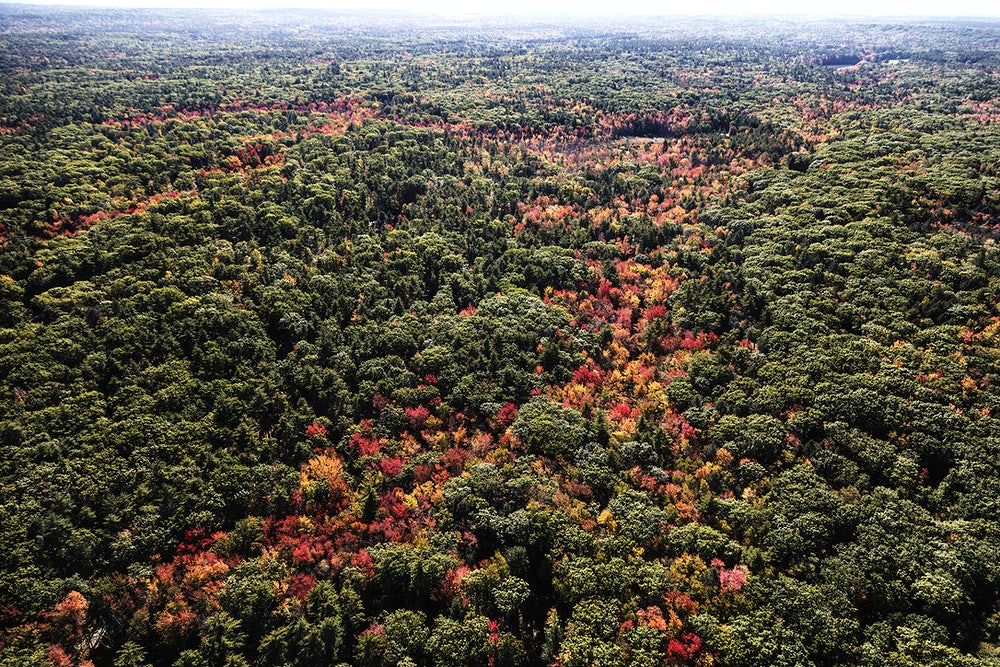
- An October 2017 aerial view of a mixture of evergreens (Maine is known as the Pine Tree State) and deciduous trees at the height of their fall colors in the forests near Ogunquit, Maine. (2017, October 18). Library of Congress. Retrieved October 25, 2022, from https://www.loc.gov/item/2017883331/
Teacher Note
Teachers, these mini lessons/student activities are perfect "warm up" tasks that can be used as a hook, bell ringer, exit slip, etc. They take less than a class period to complete. Learn more on the "My NASA Data What are Mini Lessons?" page.
Teachers who are interested in receiving the answer key, please complete the Teacher Key Request and Verification Form. We verify that requestors are teachers prior to sending access to the answer keys as we’ve had many students try to pass as teachers to gain access.
Disciplinary Core Ideas:
- LS1C: Organization for Matter and Energy Flow in Organisms
- LS2B: Cycles of Matter and Energy Transfer in Ecosystems
- ESS2A: Earth Materials and Systems
Crosscutting Concepts:
- Scale, Proportion, and Quantity
- Systems and System Models
Science and Engineering Practices:
- Developing and Using Models
- Analyzing and Interpreting Data
- Using Mathematics and Computational Thinking