Mini Lesson/Activity
Analyzing Seasonal Vegetation & Leaf Area
Overview
Students observe seasonal images of Monthly Leaf Area, looking for any changes that are occurring throughout the year.
Student Directions
Background:
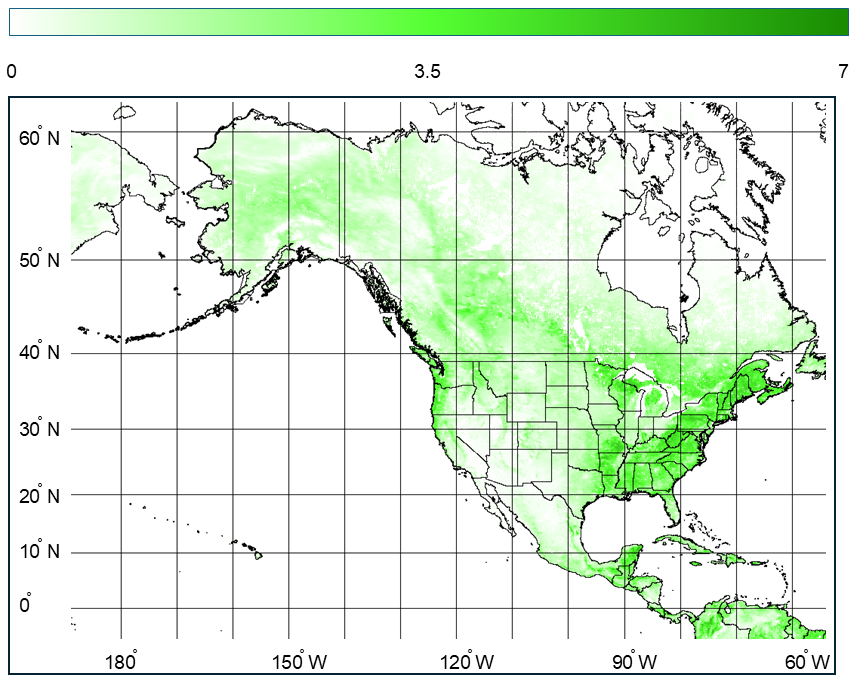
One of the key "vital signs" of Earth's vegetation is the total green leaf area for a given ground area. The Moderate Resolution Imaging Spectroradiometer (MODIS) aboard NASA's Terra and Aqua satellites collects global Leaf Area Index (LAI) data on a daily basis. The map above shows the LAI for the time period indicated, expressed in terms of square meters of leaf area per square meter of ground area. Values range from 0 to 7 square meters of leaf area per square meter of land surface.
How can there be more square meters of leaf than land surface in an area? Because the vegetation grows in layers above the ground. For instance, an LAI value of 5 means that there are five layers of leaves in that area. A value of less than 1 means that if you gathered all the leaves in an area and laid them flat on the ground, there wouldn't be enough to cover the land surface.
Knowing the total leaf area in a plant canopy helps scientists determine how much water will be stored and released by an ecosystem. It will also determine how much leaf litter it will generate, and how much photosynthesis is occurring. This information helps scientists understand the flow of energy among the various layers of vegetation, the atmosphere, and the ground. These factors all have an affect on climate.
Observe seasonal images of Monthly Leaf Area Index and look for any changes that are occurring throughout the year. Answer the following questions.
Steps:
- Check with your instructor on how to submit your answers.
- The Monthly Leaf Area Index maps (Plots A-D) are in chronological order, starting with the time periods: February 2025, June 2025, October 2025, and February 2026. Identify the seasonal cycles for leaf changes throughout the year by answering the following questions:
- What changes do you see through the year? What explanations can you suggest for these patterns?
- Choose a location or region. During which months do the extreme highs and lows occur? What explanations can you suggest for the timing of those extremes?
- Which regions experience both the extreme highs and lows? Which regions don’t experience the extremes? Why do you think this happens?
- What regions remained relatively unchanged over the year, if any? Why do you think this happens?
Source:
Teacher Note
Teachers: The seasonal global images can be downloaded, printed, and distributed in a Face-to-Face setting, along with the questions below. Alternatively, virtual learners will need to access the Monthly Leaf Area Index, Plot A-D images to view the maps.
If students have trouble locating significant changes have them focus their attention on one location on the image throughout the year.
After several minutes, ask the groups to share with the entire class their discoveries of patterns and their interpretation of those patterns.
Teachers, these mini lessons/student activities are perfect "warm up" tasks that can be used as a hook, bell ringer, exit slip, etc. They take less than a class period to complete. Learn more on the "My NASA Data What are Mini Lessons?" page.
Teachers who are interested in receiving the answer key, please complete the Teacher Key Request and Verification Form. We verify that requestors are teachers prior to sending access to the answer keys as we’ve had many students try to pass as teachers to gain access.
Disciplinary Core Ideas:
- ESS2A: Earth Materials and Systems
Crosscutting Concepts:
- Patterns
- Scale, Proportion, and Quantity
- Systems and System Models
Science and Engineering Practices:
- Developing and Using Models
- Analyzing and Interpreting Data

Interactive Files
Grade Band
- 6-8
Time
- 15 minutes
Visualization Tool
NGSS Three Dimensional Learning
- See drop-down menu at the bottom of the page