Interactive Models
Phytoplankton Distribution and Watersheds
Overview
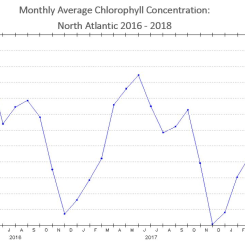
Using interactive maps of chlorophyll concentration, students will identify patterns to describe the relationship between phytoplankton and watersheds.
This interactive model is one of a three-part sequence of learning experiences related to Global Phytoplankton Distribution. To maximize optimal learning outcomes, it is suggested to complete the series in the following order:
- Global Phytoplankton Distribution Interactive Model
- Phytoplankton Distribution and Watersheds Interactive Model (current page)
- Chlorophyll Concentration and Incoming Shortwave Radiation Interactive Model
This story map is intended to be used with students who have access to a computing device in a 1:1 or 1:2 setting.
Materials Required
Resources Needed Per Student:
- Student Data Sheet (Optional)
- Computer/Tablet
- Internet Access
- Link to Phytoplankton Distribution and Watersheds Interactive Model
Directions
- Using an internet accessible device, students open the link to the Phytoplankton Distribution and Watersheds Interactive Model to begin their exploration of this phenomenon.
- Distribute the Phytoplankton Distribution and Watersheds Interactive Model Student Sheet (optional). Have students navigate on their own through the interactive model to answer the questions and complete the activities on their student sheet.
![]()
Teacher Note
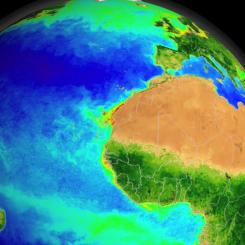
At the bottom of the ocean's food chain, phytoplankton account for roughly half of the net photosynthesis on Earth. Their photosynthesis consumes carbon dioxide and plays a key role in transferring carbon from the atmosphere to the ocean. Unlike the plant ecosystems on land, the amount of phytoplankton in the ocean is always followed closely by the abundance of organisms that eat phytoplankton, creating a perpetual dance between predators and prey.
To learn more, visit:
- The Phytoplankton Distribution Phenomena page for background information
Teachers who are interested in receiving the answer key, please complete the Teacher Key Request and Verification Form. We verify that requestors are teachers prior to sending access to the answer keys as we’ve had many students try to pass as teachers to gain access.
Disciplinary Core Ideas:
- LS2B: Cycles of Matter and Energy Transfer in Ecosystems
- ESS2A: Earth Materials and Systems
Crosscutting Concepts:
- Patterns
- Systems and System Models
Science and Engineering Practices:
- Developing and Using Models
- Analyzing and Interpreting Data
- Constructing Explanations and Designing Solutions
- Students will analyze and describe the distribution of phytoplankton over time and space.
- Students will identify patterns in chlorophyll concentration data to formulate their explanations of phytoplankton distribution.
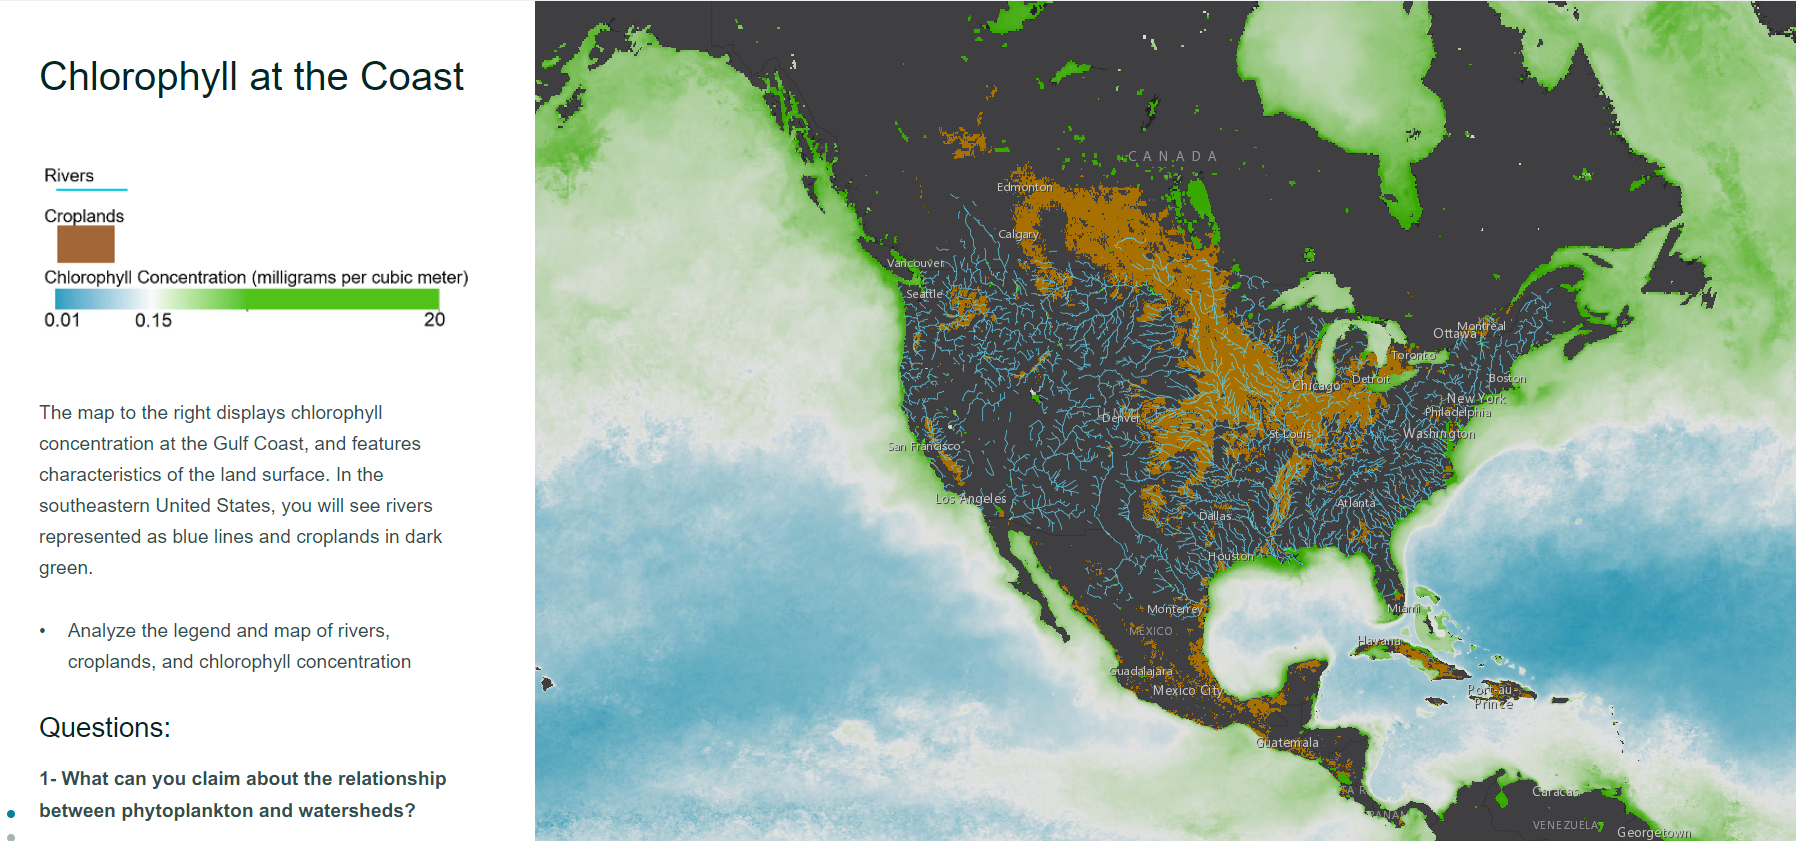
- What can you claim about the relationship between phytoplankton and watersheds?
- What questions could you ask about these data?
- One-to-One (tablet, laptop, or CPU)
- One-to-a-Group
Complementary Interactives

Interactive Files
Grade Band
- 3-5
- 6-8
- 9-12
Time
- 30 minutes
Visualization Tool
NGSS Three Dimensional Learning
- See drop-down menu at the bottom of the page