color hydrosphere icon
Just one moment,
loading Hydrosphere...

Featured Lesson Plans

Google document icon.
Google slides icon.
Grade Level: 6-8, 9-12

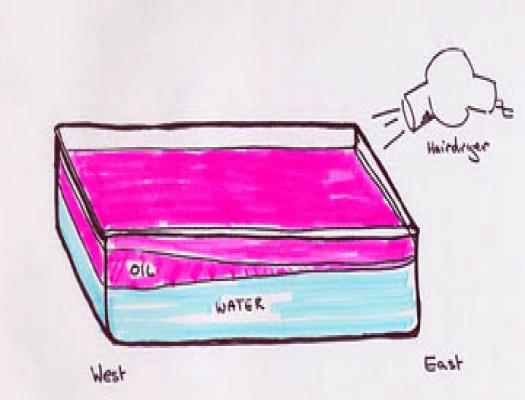
Students will examine a 2014-2015 El Niño Southern Oscillation (ENSO) event to identify relationships among sea surface height, sea surface temperature, precipitation, and wind vectors.

Grade Level: 3-5, 6-8, 9-12

This lesson plan provides some generic maps, graphs, and data tables for use with the Data Literacy Cube. Because it is a differentiated resource, this lesson plan is appropriate for multiple grade bands. 

Grade Level: 6-8

In this activity, students will analyze a NASA sea surface height model of El Niño for December 27, 2015, and answer questions. Then they will be instructed to create a model of their own made from pudding to reflect the layers of El Niño.

Grade Level: 6-8

The El Niño Implementation Sequence provides a series of lessons and activities for students to learn about a condition that sometimes occurs in the Pacific Ocean, but it is so big that it affects weather all over the world.

Grade Level: 3-5, 6-8, 9-12

The Earth System Satellite Images, along with the Data Literacy Cubes, helps the learner identify patterns in a specific image.