Lesson Plans
El Niño Southern Oscillation: Data Literacy Cubes
Overview
This lesson plan provides some generic maps, graphs, and data tables for use with the Data Literacy Cube. Because it is a differentiated resource, this lesson plan is appropriate for multiple grade bands.
Materials Required
- 1 Cube per group/student (or die)
- 1 differentiated Cube Question Sheet per student
- 1 sheet of paper per student
- Pencil
- El Niño Southern Oscillation: Maps, Graphs, and Data Images
Teacher Preparation:
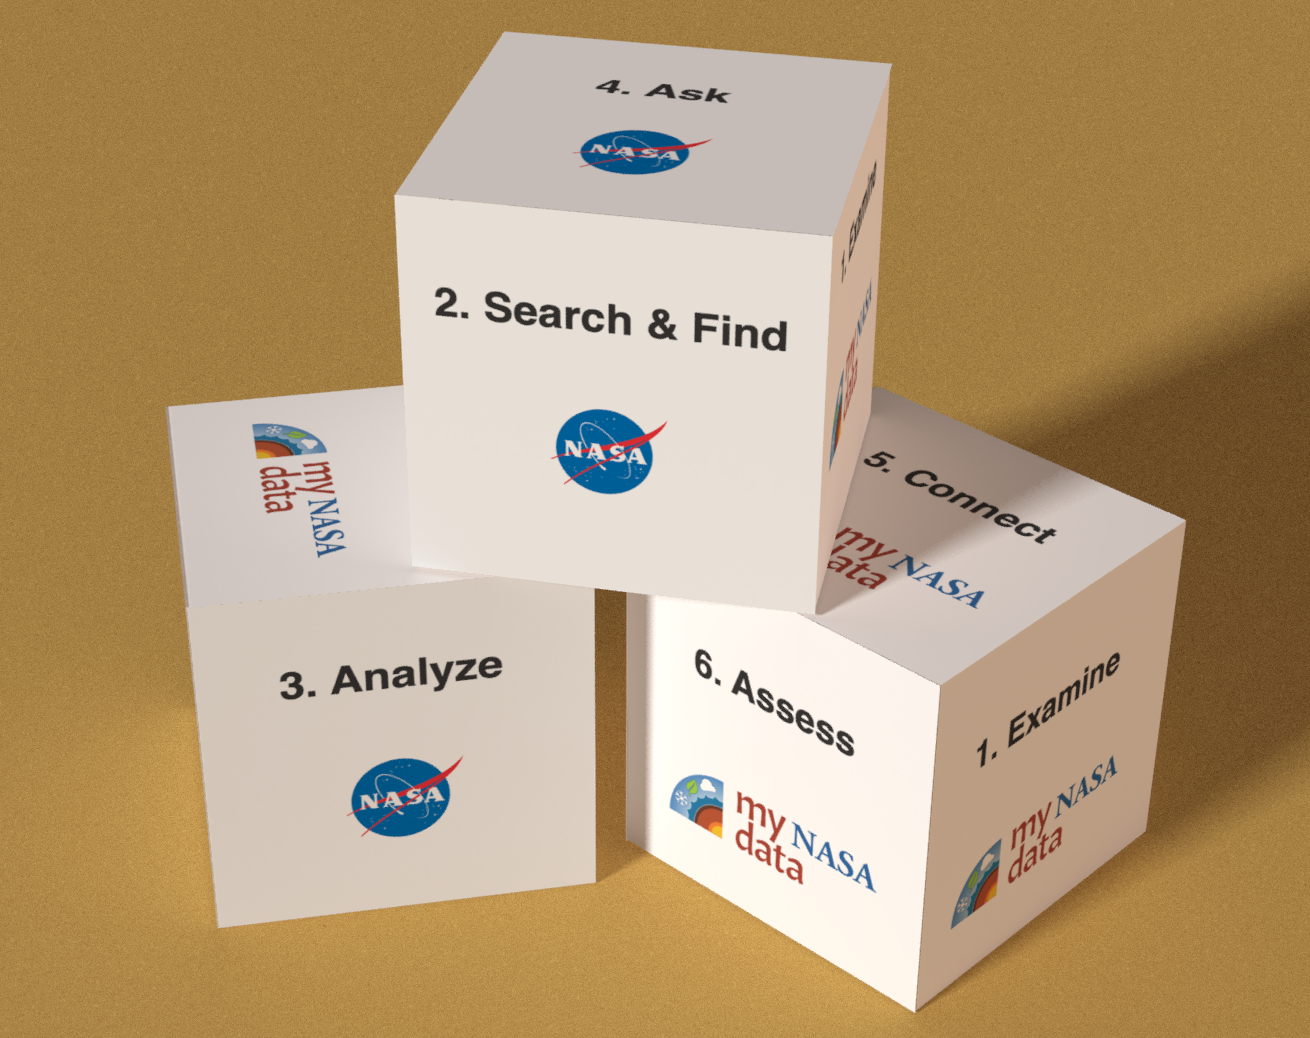
Print copies of the cube on cardstock and cut out. Assemble the cube with glue. Note: consider laminating after you cut these out for multiple uses. (Gaming dice may be substituted for the cubes.) Also, print off copies of the differentiated Graph Cube Questions. Distribute to students for group or independent work.
Procedure
Steps:
- Distribute your Earth science Map, Graph, or Dataset to the group or groups of students as well as one data cube from the Cube Template (or regular die).
- Distribute the appropriate-leveled Questions Sheet to each group.
- Assign each student a role from the Task Card for each group.
- Students roll the cube and answer the matching question on the associated Question Sheet.
- Answer one question found under the matching question on a sheet of paper, labeling the question with the number and letter of the question.
- Have each group share with another group or with the class after completing their question sheet.
- Monitor student progress and assign new level sets as students reuse the cubes throughout the year.
- Repeat Steps 2-4 until at least 6 are answered.
Disciplinary Core Ideas:
- ESS2D: Weather and Climate
Crosscutting Concepts:
- Patterns
- Scale, Proportion, and Quantity
- Systems and System Models
- Stability and Change
Science and Engineering Practices:
- Analyzing and Interpreting Data
- observe and interpret physical characteristics of the Earth System using graphs of NASA data
- write a claim about the variables in the graph
- analyze how the phenomena changes of time and space
- characterize the independent and dependent variables
- brainstorm the phenomena connects to other parts of the Earth System
- How are the data represented in the graph?
- How do we identify a change in these data?
- How does a change in the independent variable affect the other variable?
- What relationship do you claim exists among these variables?
For more information about how to use the Data Literacy Cubes, visit our YouTube page and watch the Data Literacy Cubes playlist tutorials.
Use the task cards found in the Data Literacy Cube Guide to support student work.
- Standalone Lesson (no technology required)


Grade Band
- 3-5
- 6-8
- 9-12
Time
- 30 minutes
Visualization Tool
NGSS Three Dimensional Learning
- See drop-down menu at the bottom of the page