Lesson Plans
Creating an El Niño Model
Overview
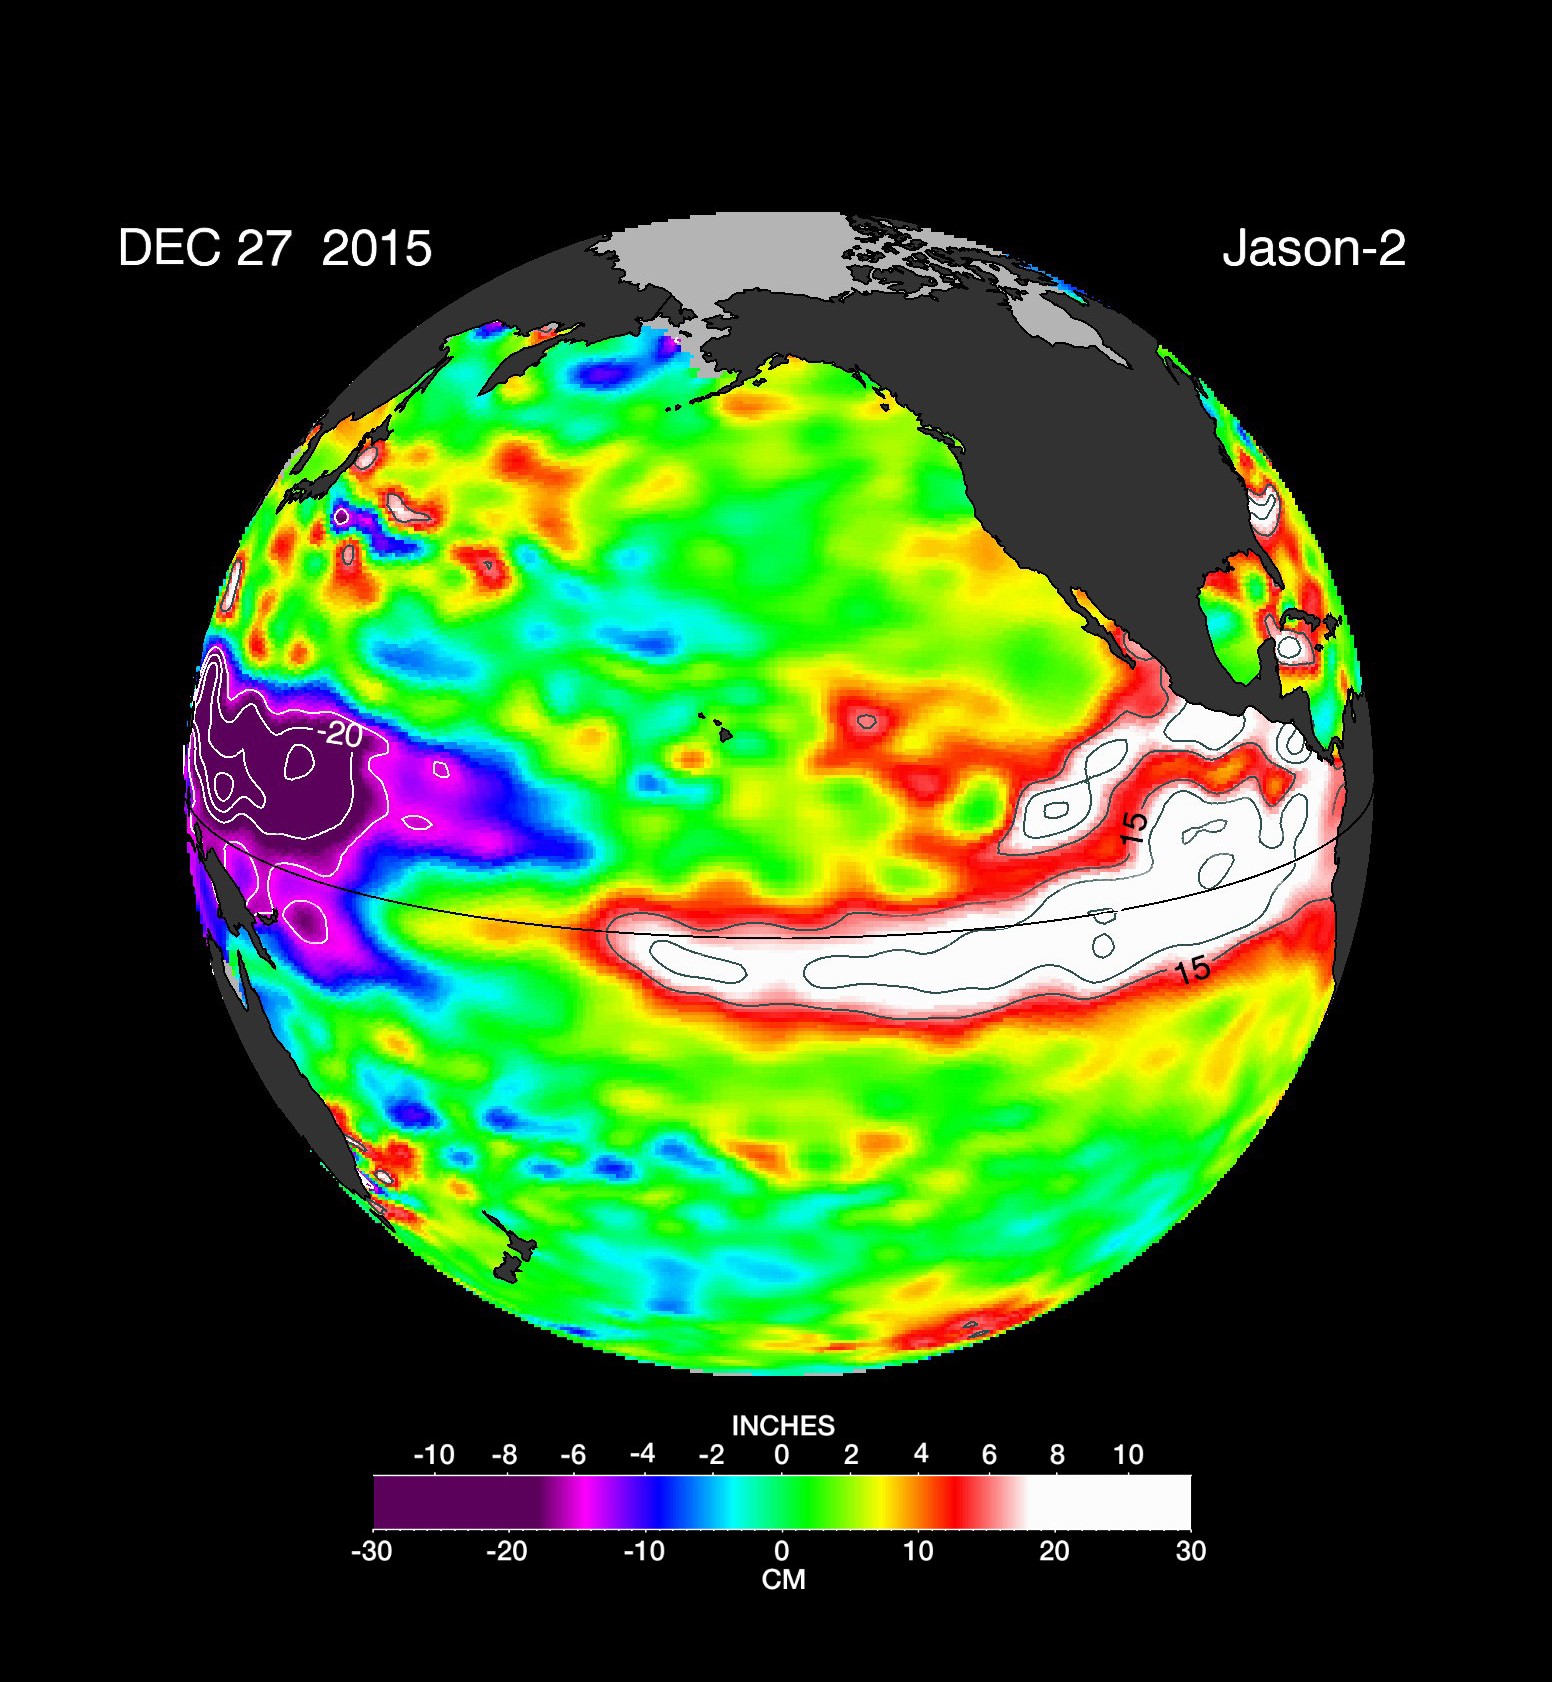
In this activity, students will analyze a NASA sea surface height model of El Niño for December 27, 2015, and answer questions. Then they will be instructed to create a model of their own made from pudding to reflect the layers of El Niño.
Materials Required
Pudding contents:
- Four small packages of gelatin dessert mix in these colors:
- Purple (like grape or blackberry)
- Green (lime)
- Yellow (lemon)
- Red (like cherry, raspberry, or strawberry)
- 1 quart lemon or pineapple sherbet
- Whipped cream
- Glass casserole dish or glass bowl that can hold 8 cups of liquid (Preferably flat)
- Measuring cup
- Four mixing bowls (or fewer, if you wash them out between colors)
- Rotary beater or whisk
Procedure
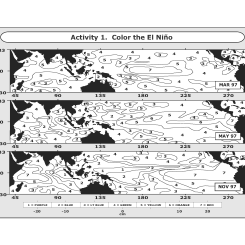
In this activity, students will analyze a model from the Jason-2 satellite of sea surface height in the equatorial Pacific. The color legend shows the difference from normal sea height in centimeters.
Instruct students to use the color image and scale provided as a guide for the model to answer the following questions.
Questions:
- How many centimeters below normal sea height does the purple range represent?
- What does the green range represent?
- How many centimeters above normal sea height does the yellow range represent?
- How many centimeters above normal sea height does the red range represent?
- How many centimeters above normal sea height does white represent?
- What is the difference between the green and purple ranges?
- What is the difference between the yellow and green ranges?
- What is the difference between the red and yellow ranges?
- What is the difference between the red range and the white?
- How many millimeters are in one centimeter?
- If you change the unit from centimeters without converting, how many times smaller will the numbers be?
The following activity has been modified from the activity found at NASA Space Place: What is El Niño anyway?
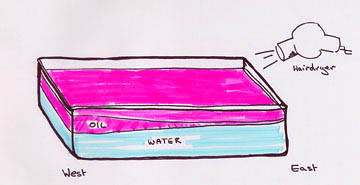
Whip Up Some El Niño Pudding!
ALWAYS BE SAFE - THIS ACTIVITY INVOLVES BOILING WATER - ADULT SUPERVISION REQUIRED
What you need:
- Four small packages of gelatin dessert mix in these colors:
- Purple (like grape or blackberry)
- Green (lime)
- Yellow (lemon)
- Red (like cherry, raspberry, or strawberry)
- 1 quart lemon or pineapple sherbet
- Whipped cream
- Glass casserole dish or glass bowl that can hold 8 cups of liquid (Preferably flat)
- Measuring cup
- Four mixing bowls (or fewer, if you wash them out between colors)
- Rotary beater or whisk
What to do:
- Do these steps for each of the four colors of gelatin:
- Dump the gelatin mix into a bowl. Add 1 cup of boiling water and stir until the gelatin is completely dissolved.
- Important! Let the gelatin mixture COOL to room temperature.
- When the gelatin mixture is cool, add 3/4 cup of the sherbet, and mix in with the beater or whisk.
- Use the differences between the color ranges to determine the thickness for each layer in the model. You will use millimeters rather than centimeters.
- Purple (bottom) - difference between green and purple (16 millimeters or 1.6 centimeters)
- Green - difference between yellow and green (4 millimeters or 0.4 centimeters)
- Yellow - difference between red and yellow (6 millimeters or 0.6 centimeters)
- Red (top) - difference between red and white (4 millimeters or 0.4 centimeters)
- One color at a time, carefully pour the "pudding" mixtures into the glass dish. Pour the colors in this order and try to make them the thicknesses calculated. If you want a particular color to be on the top in part of your model, don't put more colors on top of it.
- Purple (bottom) (20 millimeters or 2.0 centimeters)
- Green (7 millimeters or 0.7 centimeters)
- Yellow (6 millimeters or 0.6 centimeters)
- Red (top) (5 millimeters or 0.5 centimeters)
- Put the "pudding" into the refrigerator until it is completely set.
- Now for the artistic part.
- Use the whipped cream to make the white "El Niño." This represents the highest part of the ocean.
- When you are ready to serve, scoop out the servings at an angle so that you can see all the different layers from the top.
Wrap Up Questions:
- What do the different colors of gelatin represent?
- Where was the sea height the highest?
- Why is the sea level higher in these locations?
Answers:
Teachers who are interested in receiving the answer key, please complete the Teacher Key Request and Verification Form. We verify that requestors are teachers prior to sending access to the answer keys as we’ve had many students try to pass as teachers to gain access.
Source:
- PDFs of Space Place activities. (n.d.). NASA Space Place. Retrieved October 27, 2022, from https://spaceplace.nasa.gov/make-do-pdf/en/
Disciplinary Core Ideas:
- ESS2A: Earth Materials and Systems
Crosscutting Concepts:
- Patterns
- Scale, Proportion, and Quantity
- Systems and System Models
Science and Engineering Practices:
- Developing and Using Models
- Model changes in the Pacific Ocean during the El Niño Event
- Analyze changes of sea surface temperature
- Communicate arguments based on evidence
- How is energy transferred among the various spheres of the Earth System?
- What other parts of the Earth System may experience the effects of El Niño and how?
- How are the different spheres of the Earth System affected by El Niño?
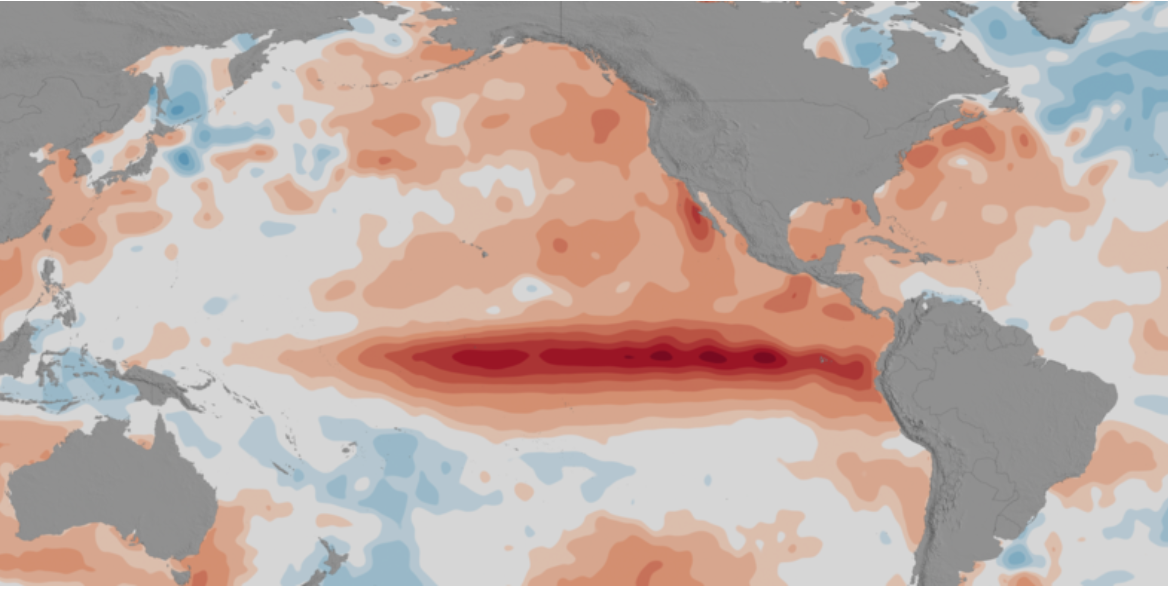
During an El Niño event, the trade winds which normally blow westward from South America toward Australia and New Guinea weaken. This results in more warm water staying off the coast of South America because it is not pushed westward. In turn, this reduces the amount of cold water that can rise and replace the warm water, a process called upwelling. With less upwelling, not as many nutrients are available for fish populations off the coast of South America. The presence of more warm water off the South American coast also leads to more rain in the area. There are also other effects around the world.
Where the ocean is warmer, the sea level will be marginally higher. The Jason-1, launched in 2001, and Jason-2, launched in 2008, satellites measure height from the Earth's surface to the satellite. This includes measuring from the ocean surfaces. Differences in sea surface height can be measured with these satellites.
Misconceptions about El Niño
- Misconception #1: All the impacts of El Niño are negative.
- Misconception #2: El Niño periods cause more disasters than normal periods.
- Misconception #3: El Niño and La Niña significantly affect the climate in most regions of the globe.
- Misconception #4: Regions that are affected by El Niño and La Niña see impacts during the entire 8 to 12 months that the climate conditions lasts.¨
- Misconception #5: We should worry more during El Niño episodes than La Niña episodes.
- Misconception #6: The stronger the El Niño/La Niña, the stronger the impacts, and vice versa.
- Misconception #7: El Niño and La Niña events are directly responsible for specific storms or other weather events.
- Misconception #8: El Niño and La Niña are closely related to global warming.
Credit: NOAA Climate.gov
- 8th Grade 7.1: The physical processes that shape the patterns of Earth's surface: The four components of Earth’s physical systems (the atmosphere, biosphere, hydrosphere, and lithosphere) are interdependent
- 8th Grade 8.2: Characteristics and Geographic Distribution of Ecosystems: Physical processes determine the characteristics of ecosystems
Weather and climate change through complex links between the oceans and the atmosphere. Sources of variability in weather and climate around the world are changes in water currents, atmospheric pressure, and temperature in the oceans, especially the Pacific Ocean. These changes in the Pacific are often referred to as the El Niño Southern Oscillation, or ENSO. If you want to understand how interconnected our planet is—how patterns and events in one place can affect life half a world away—study the ENSO phenomenon.
Two types of changes are referred to as El Niño and La Niña.This lesson focuses on El Nino which is a condition that sometimes occurs in the Pacific Ocean, but it is so big that it affects weather all over the world. NASA works with the National Oceanic and Atmospheric Administration (NOAA) and other scientific institutions to track and study ENSO in many ways. From underwater floats that measure conditions in the depths of the Pacific to satellites that observe sea surface heights and the winds high above it, scientists now have many tools to better understand ENSO events.
Although El Niño events are complex and evolve differently—as do their impacts and teleconnections—improved predictions would help communities to prepare for likely impacts and to minimize disruptions. With more advanced warning, resource managers and civic leaders could make adjustments to how they manage fisheries, which crops to plant, what resources to allocate to combating mosquitoes, and when to raise awareness of risks such as fire or mudslides. The United Nations (U.N.) Office for the Coordination of Humanitarian Affairs reported in April 2016 that 60 million people across Africa, Asia, the Pacific, and Latin America needed food assistance due to weather extremes from the 2015-16 El Niño. Looking back at 1997-98, the U.N. attributed more than 20,000 deaths and $36 billion in infrastructure damage to that El Niño. With the help of NASA and others, an improved understanding of this event may help mitigate these losses.
- Physical oceanographer - This scientist researches waves, tides, currents, transmission of light and sound in the ocean, and ocean-atmosphere relationships
- Biological oceanographer - This researcher studies marine life forms and their relationships to each other and the environment
- Meteorologists - Professionals who are involved with researching, teaching, consulting, and forecasting weather, climate, and the forces that cause change in our environment.