Grade Level: 6-8
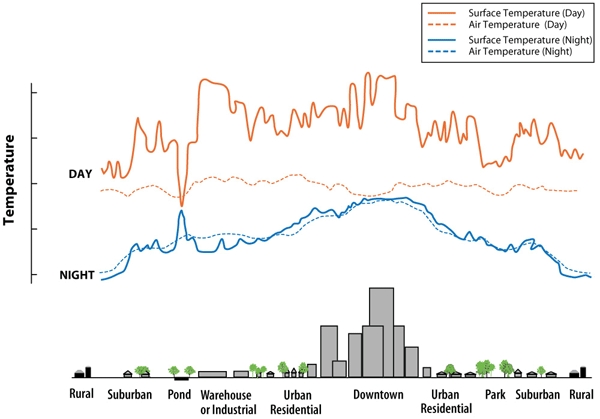
Students will analyze a line graph that shows how the surface temperature and air temperature values change over the course of 24 hours.
Select a Sphere:


Students will analyze a line graph that shows how the surface temperature and air temperature values change over the course of 24 hours.
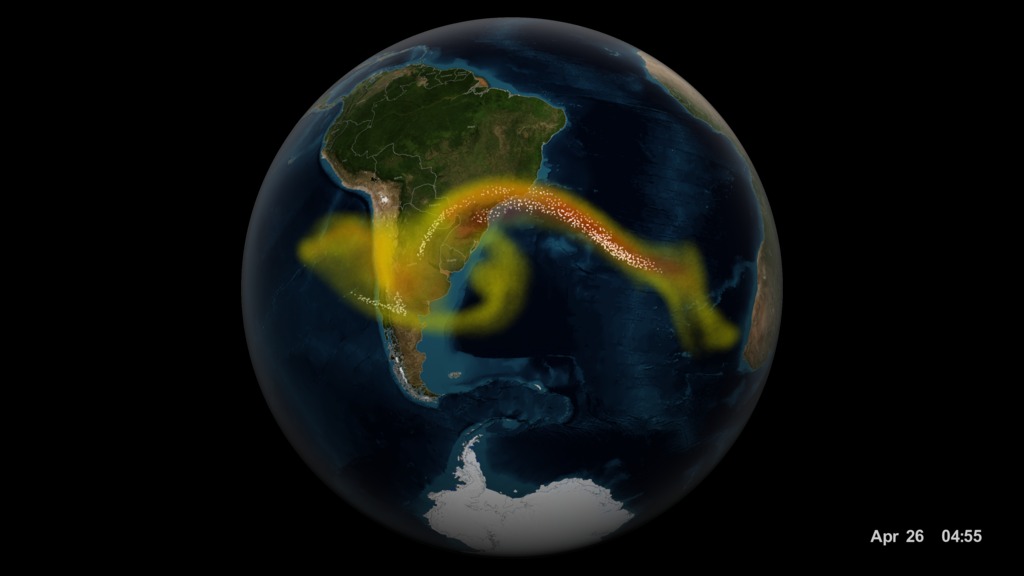
Learn about volcanic ash and watch a visualization of the Calbuco volcano to see how ash travels around the world.
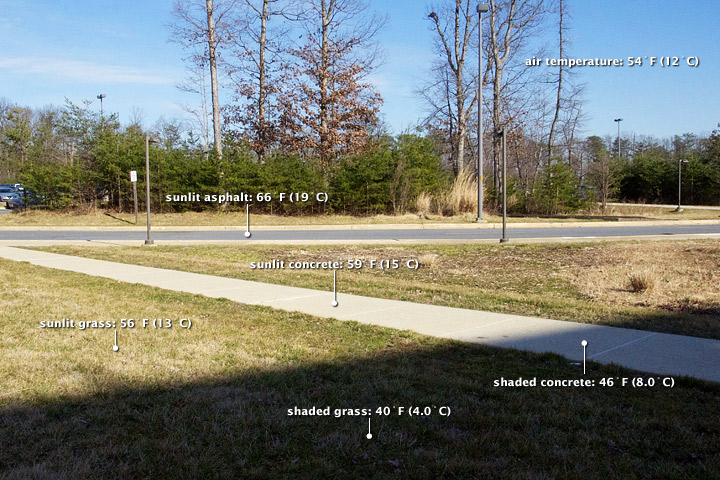
Students observe the surface temperatures of a variety of surface types found in a suburban environment.
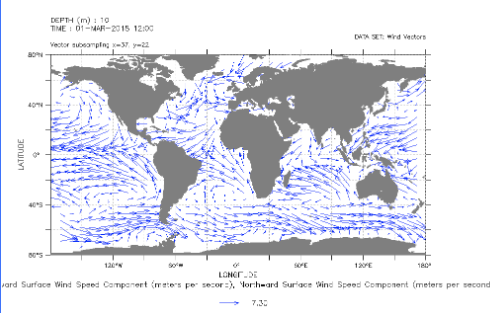
Students review an animation of monthly average wind speed at 10 meters above the ocean surface for our global ocean to analyze the relationship between winds and ocean surface currents.
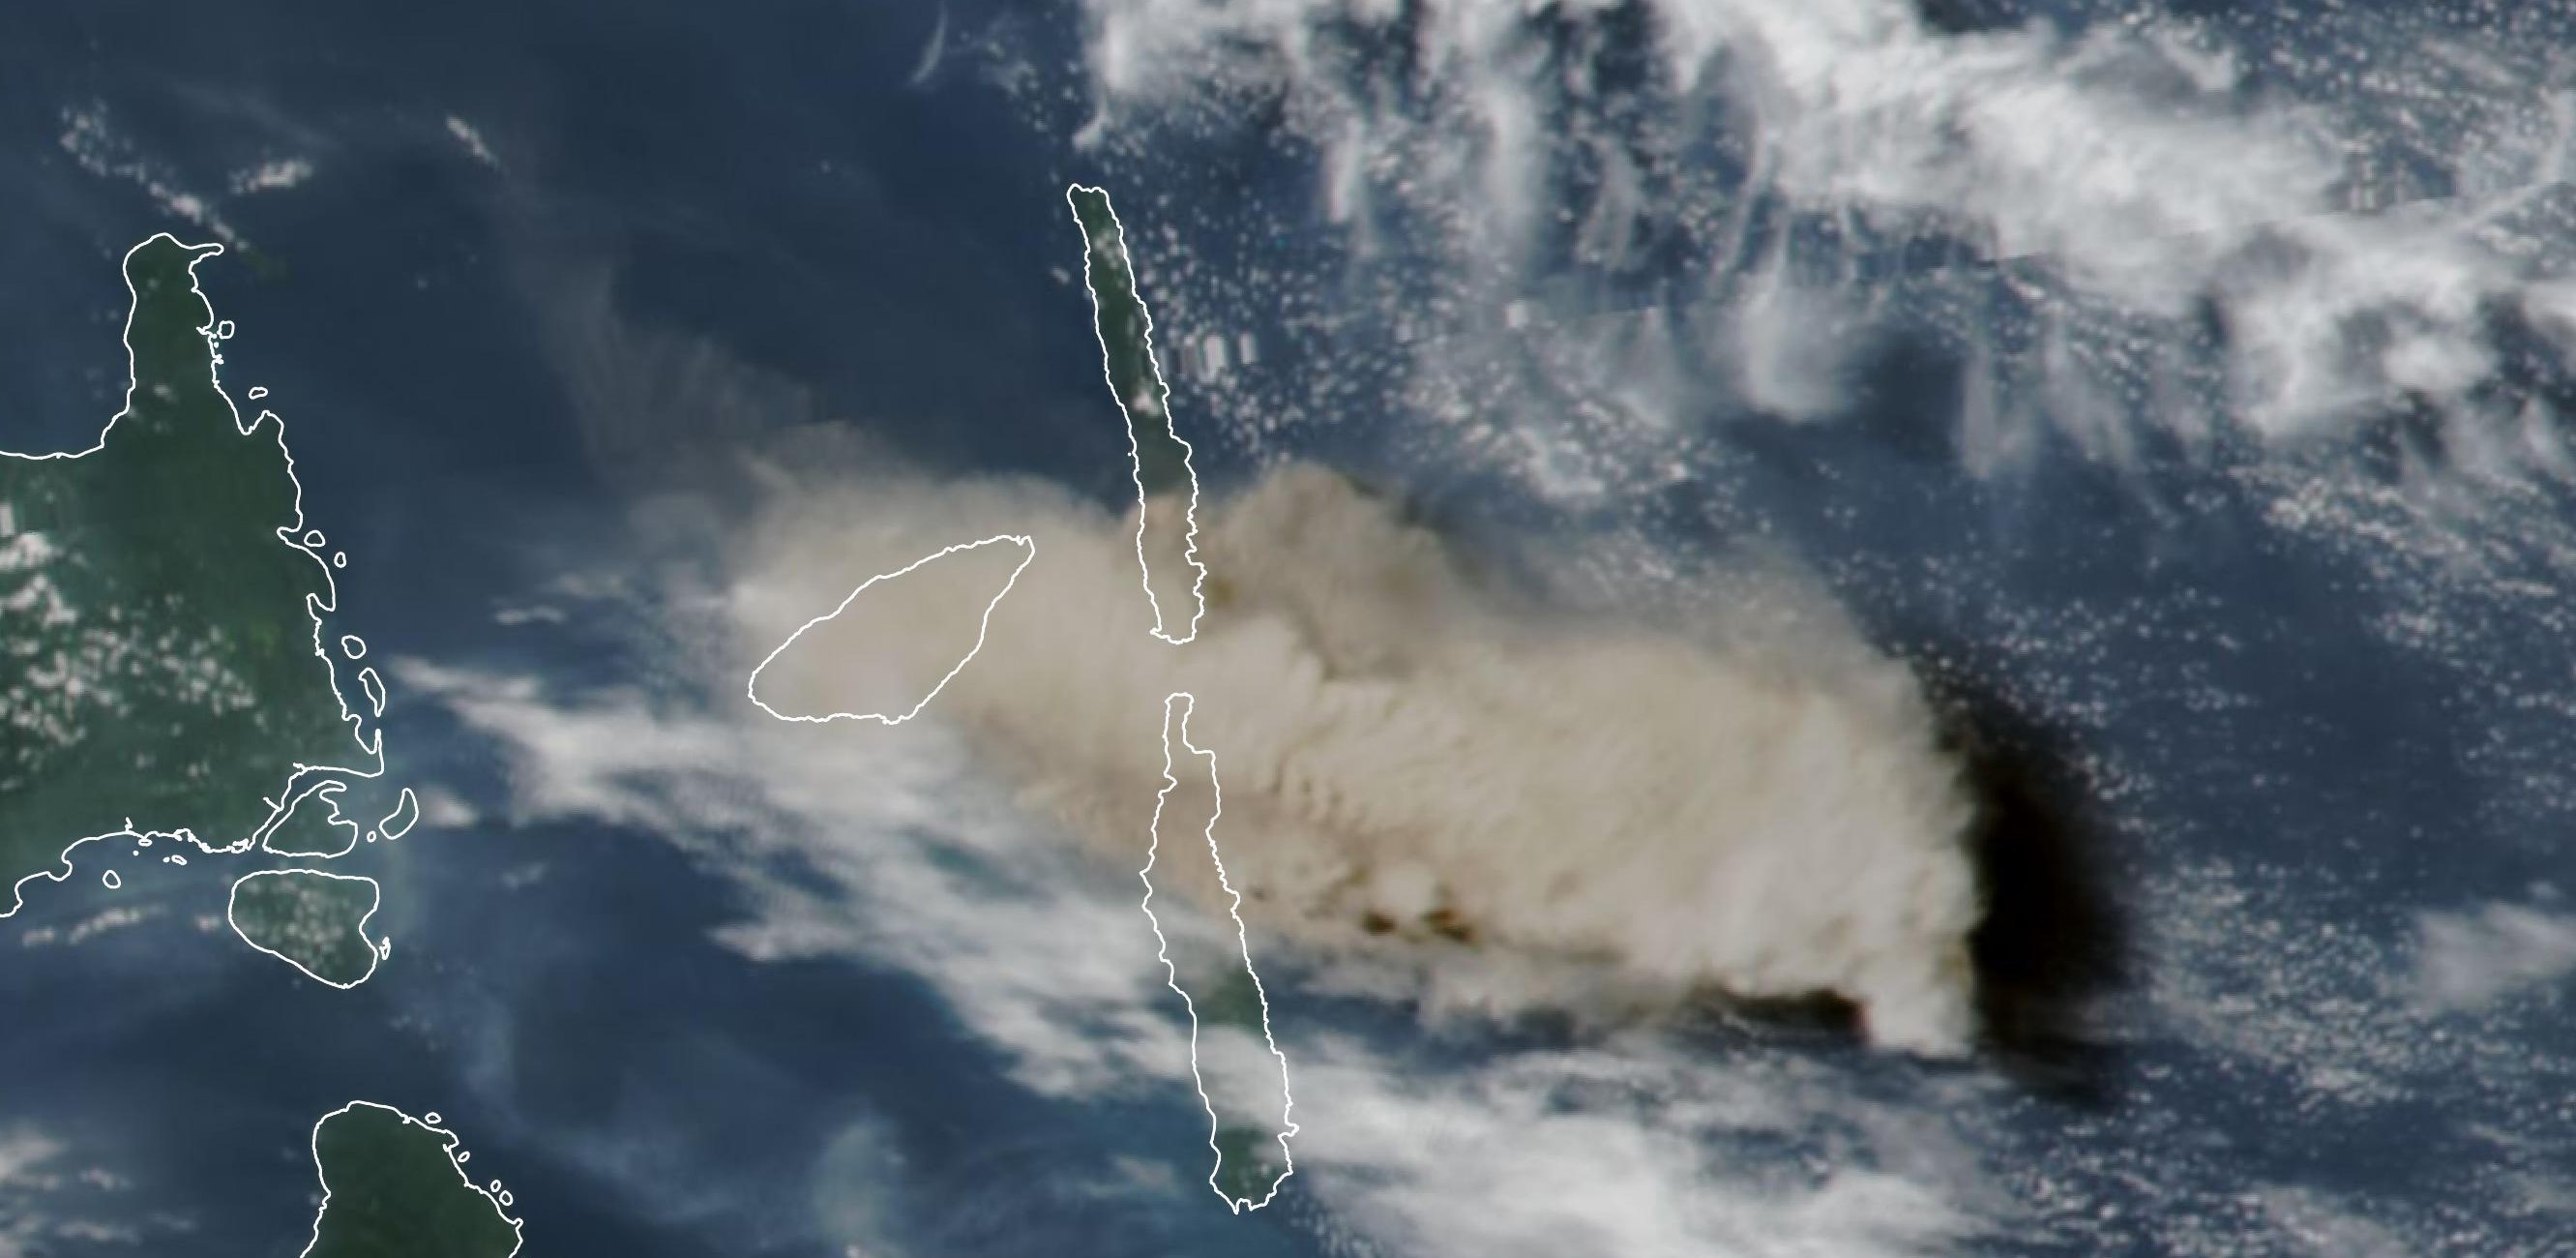
Watch NASA videos about aerosols and volcanic ash.
Students watch a video introducing the concept of albedo and answer questions.
Help learners envision themselves as explorers, scientists, technologists, engineers, and mathematicians as they venture into the summer months. Download the PDF of the two sided document on cardstock and have students imagine and illustrate themselves!
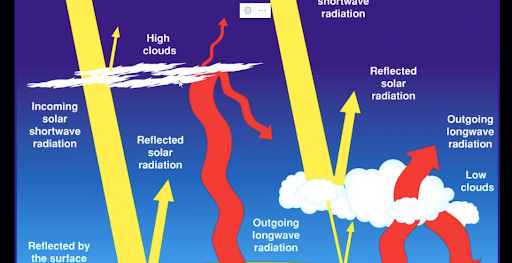
Students analyze diagrams showing the effects of clouds on Earth’s Radiation and answer the questions that follow. This mini lesson is designed to help students analyze the interaction between clouds and Earth's incoming and outgoing energy.
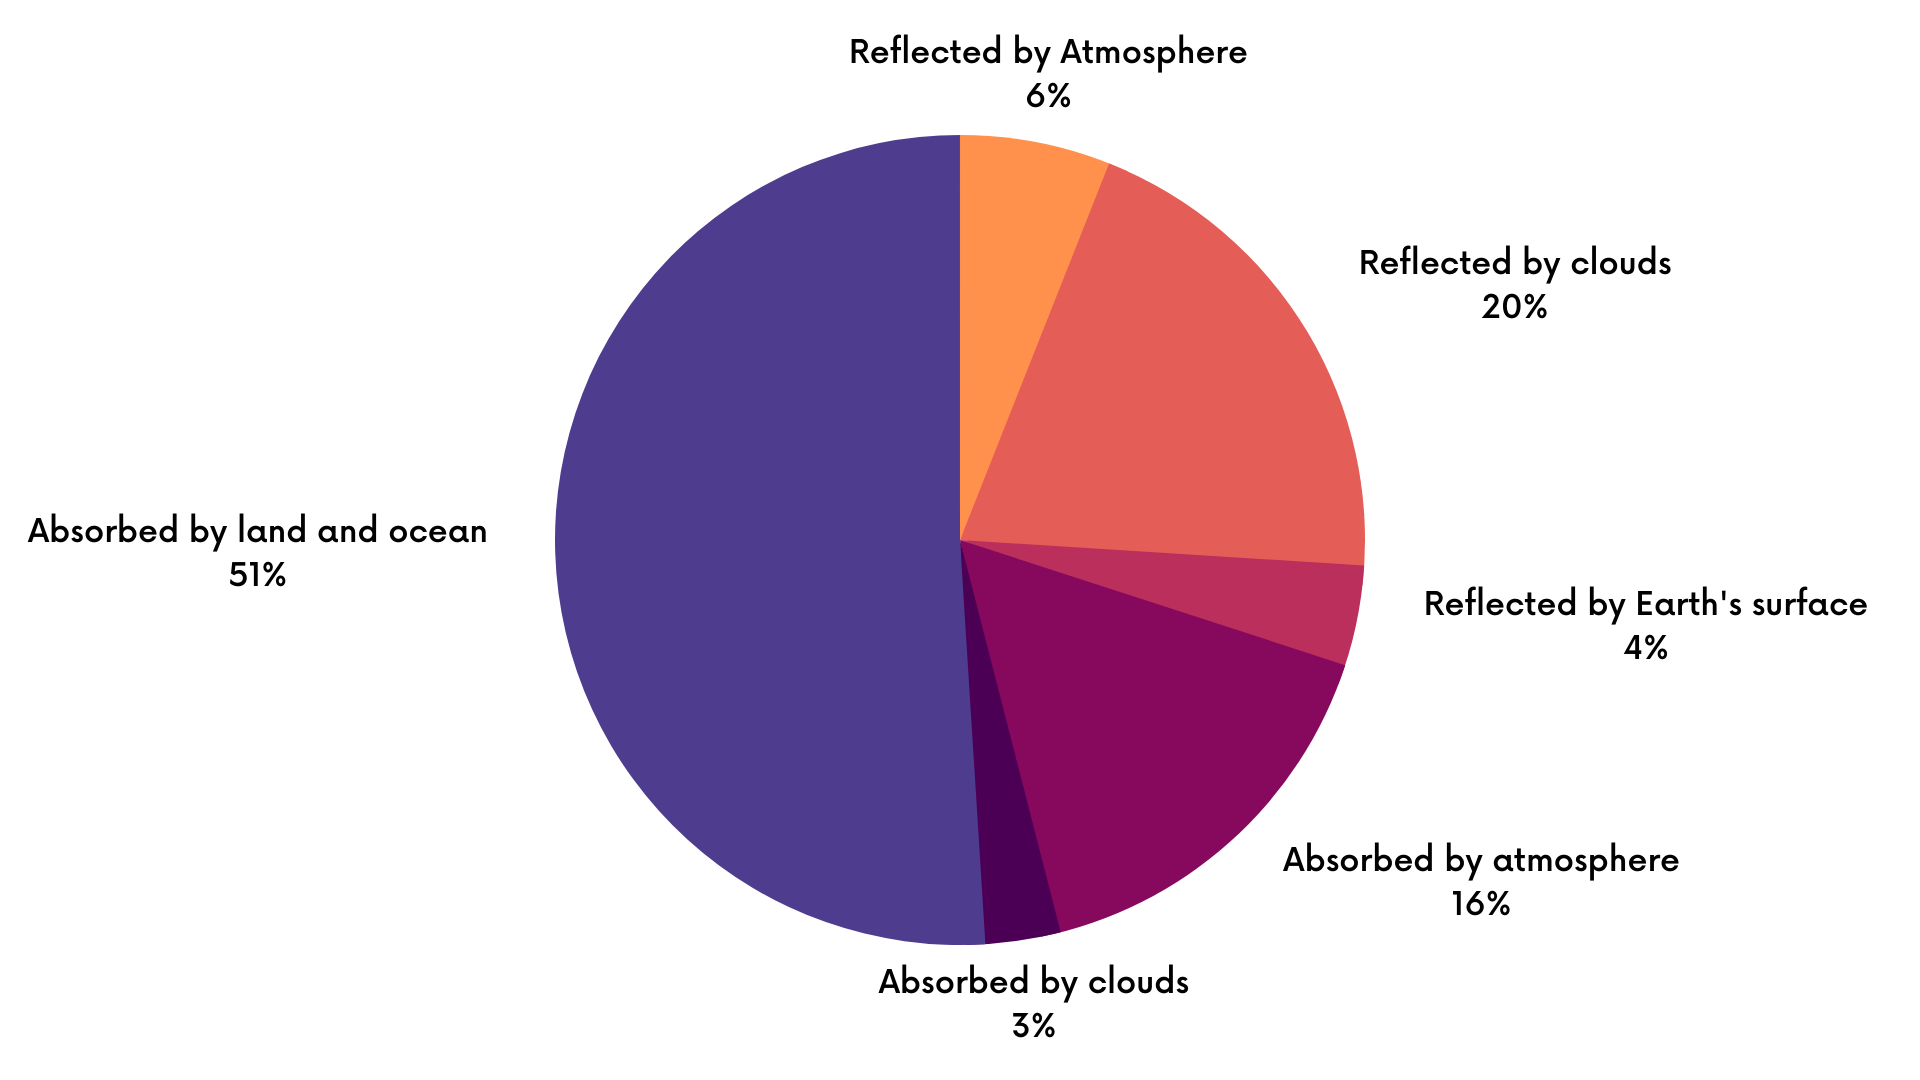
Students will analyze a pie chart (circle graph) showing the distribution of different parts of the Earth system's absorption and reflection of energy.
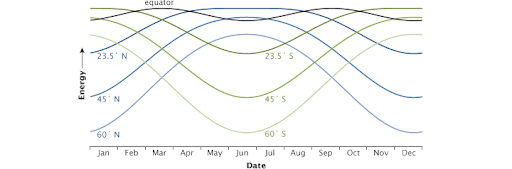
Students will analyze a graph showing the amounts of peak energy received at local noon each day over the year changes with different latitudes.
Mini lessons are intended to be short engagement activities that teachers may assign as bell-ringers, exit slips, or parts of larger learning lessons. These include activities where students interact with NASA maps, graphs, and datasets from the atmosphere, biosphere, cryosphere, geosphere, hydrosphere and the earth system.
