
Grade Level: 3-5
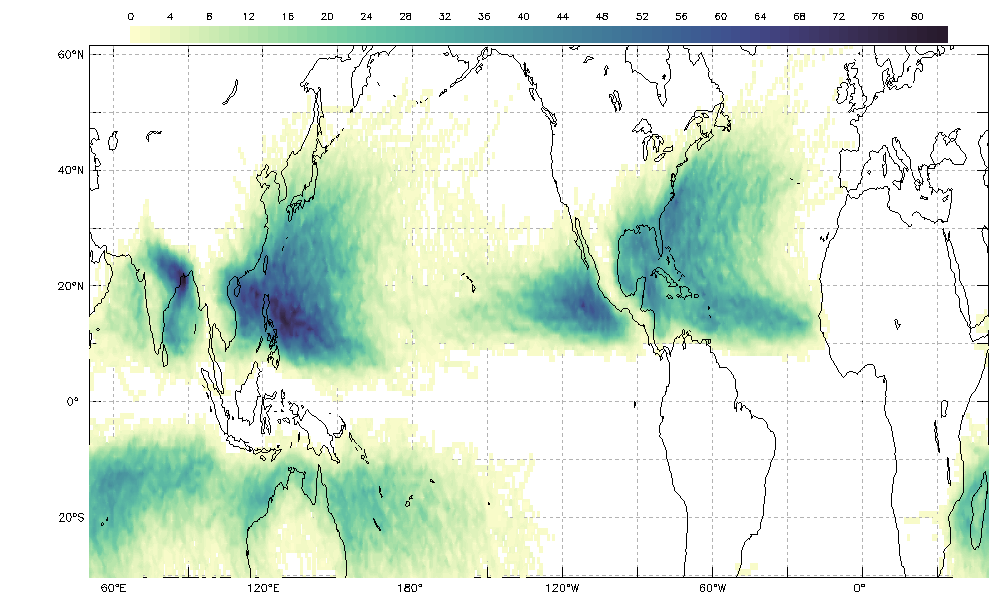
Interpret the map, or model, to find patterns in the occurrence of tropical cyclones from 1842 through 2018.
Select a Sphere:


Interpret the map, or model, to find patterns in the occurrence of tropical cyclones from 1842 through 2018.
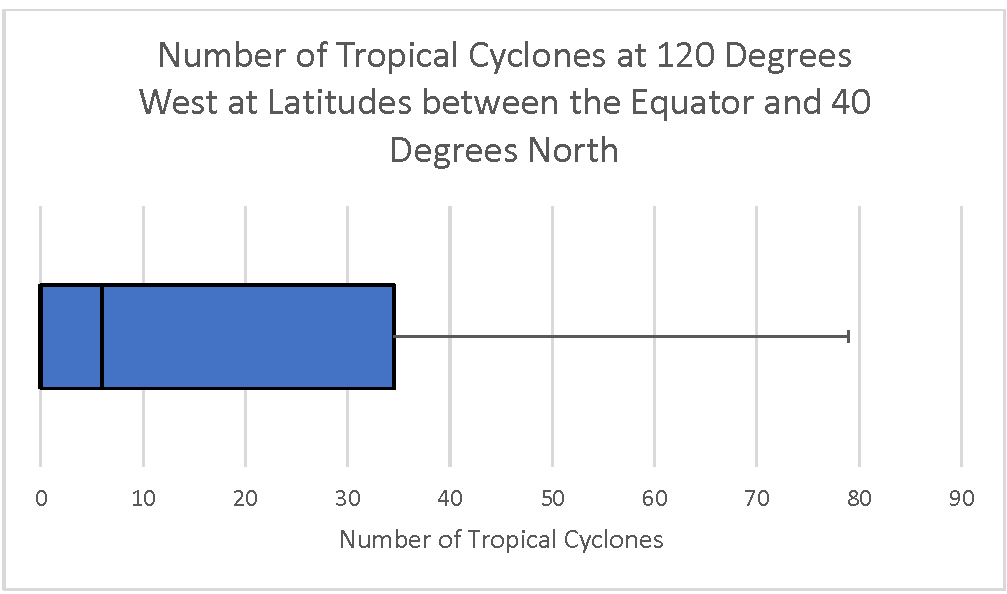
Learners will analyze and interpret a box plot and evaluate the spread of the data. Learners will compare it with a different visualization of the data to see how the two compare, discuss the limitations of the two types of data displays and formulate questions.
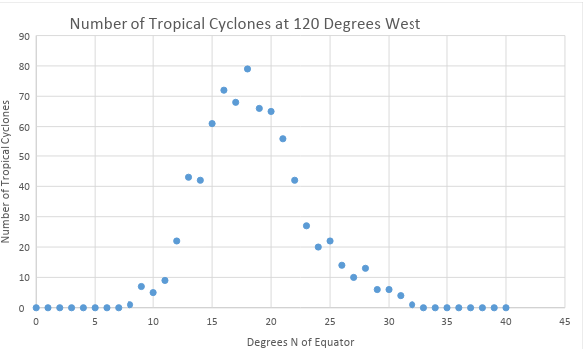
Interpret a scatter plot to find patterns in the number of tropical cyclones from 1842 to 2018.
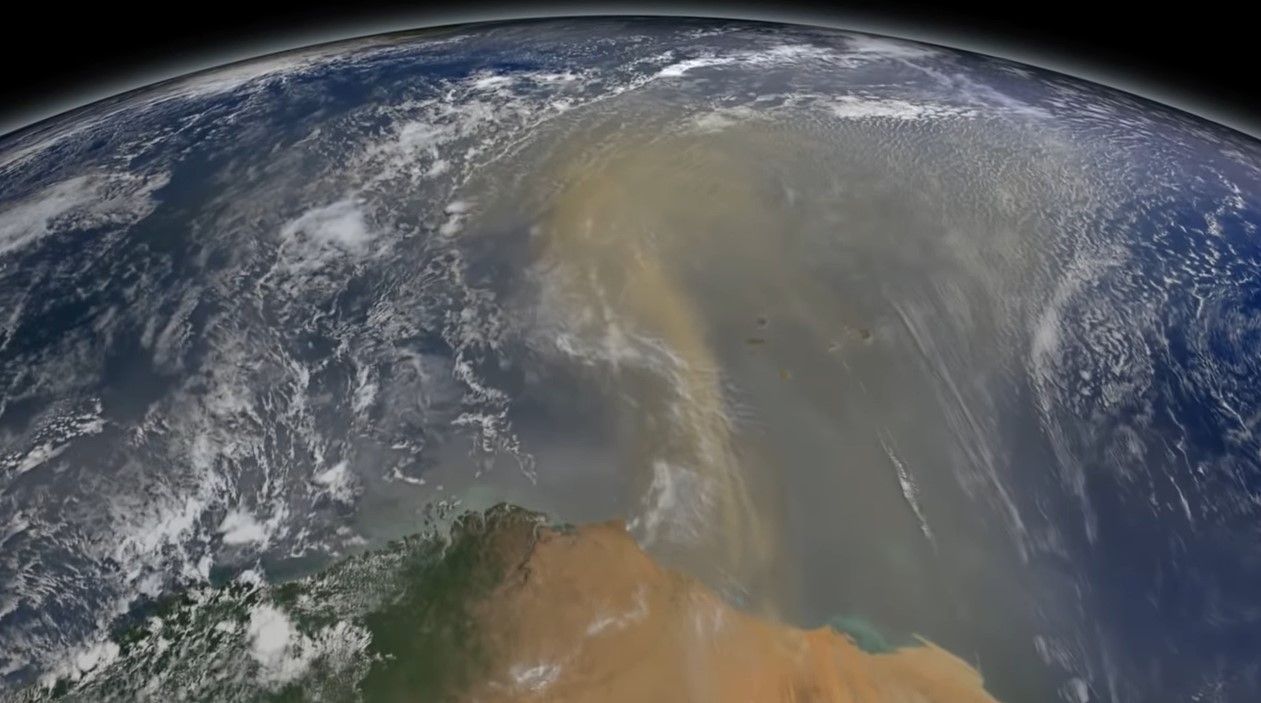
This mini lesson engages students in watching a NASA video related to accumulated dust that makes the trans-Atlantic journey from the Sahara Desert to the Amazon rainforest using NASA's CALIPSO satellite.
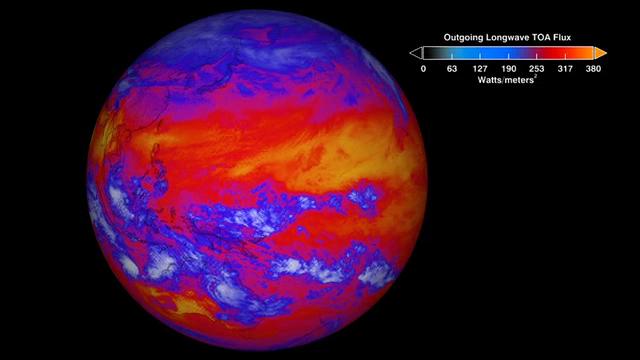
Students review a visualization showing a global view of the top-of-atmosphere longwave radiation from January 26 and 27, 2012. They review the supporting text and analyze the data in the visualization to answer questions.
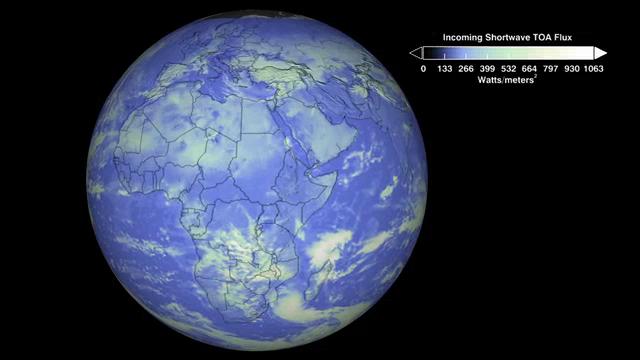
Students review a video showing a global view of the top-of-atmosphere shortwave radiation from January 26 and 27, 2012 and answer the questions that follow.
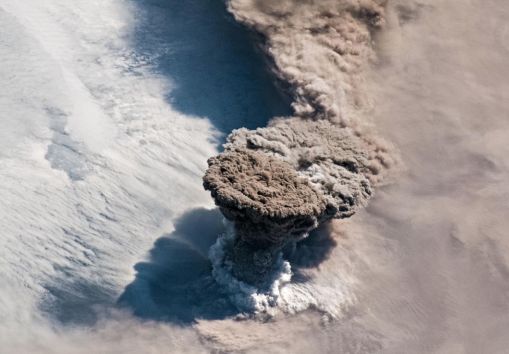
Compare images from two volcanic eruptions in the Kuril Islands which occurred ten years apart and complete a graphic organizer for impacts on different Earth spheres.
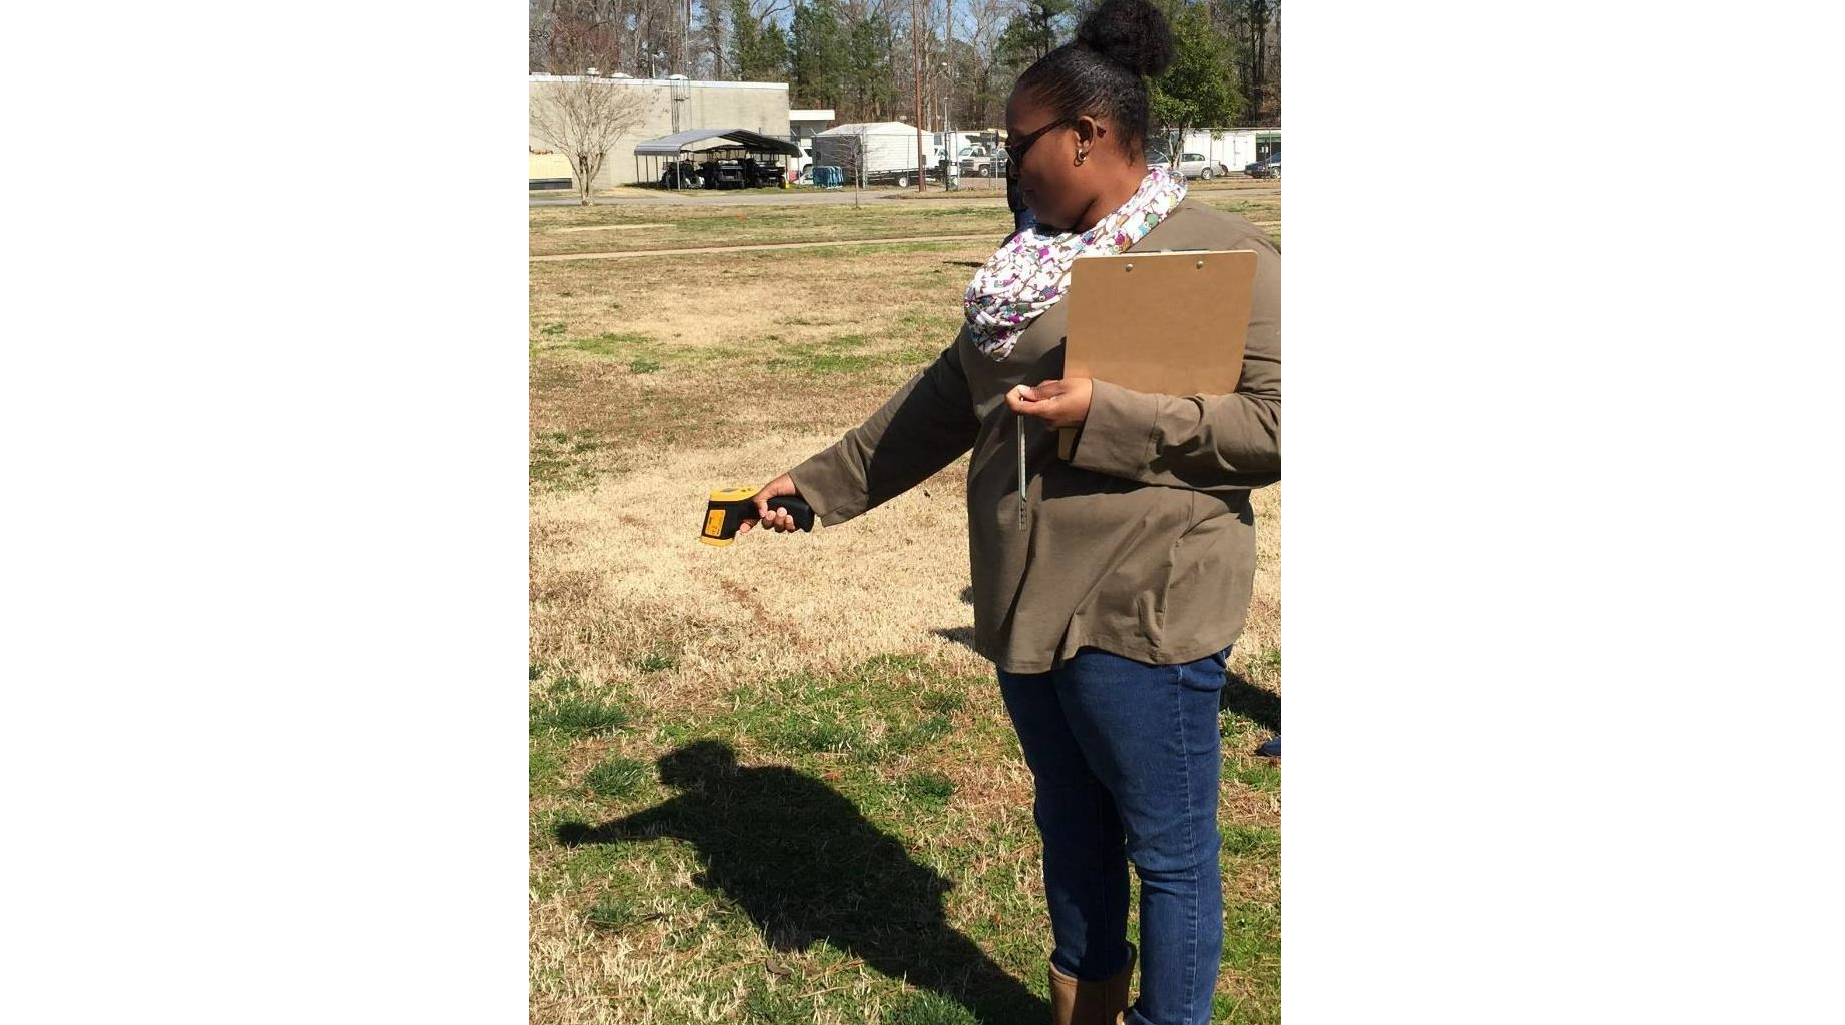
Conduct this modified EO Kids mini-lesson with your students to explore the phenomenon of Urban Heat Island Effect.

Students analyze Landsat images of Atlanta, Georgia to explore the relationship between surface temperature and vegetation.
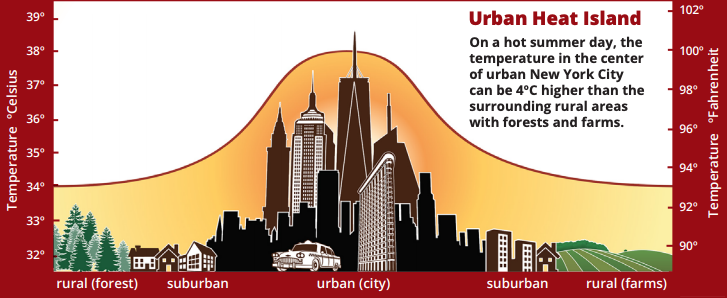
Students interpret a graph of surface temperatures taken from city districts and other types of communities.
Mini lessons are intended to be short engagement activities that teachers may assign as bell-ringers, exit slips, or parts of larger learning lessons. These include activities where students interact with NASA maps, graphs, and datasets from the atmosphere, biosphere, cryosphere, geosphere, hydrosphere and the earth system.
