Grade Level: 6-8,
9-12
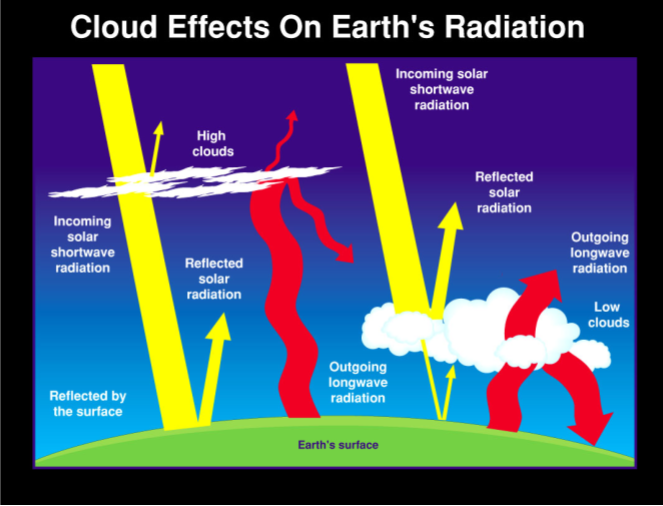
This lesson is designed to help students analyze the interaction between different cloud heights and Earth's incoming and outgoing energy.
Select a Sphere:


This lesson is designed to help students analyze the interaction between different cloud heights and Earth's incoming and outgoing energy.
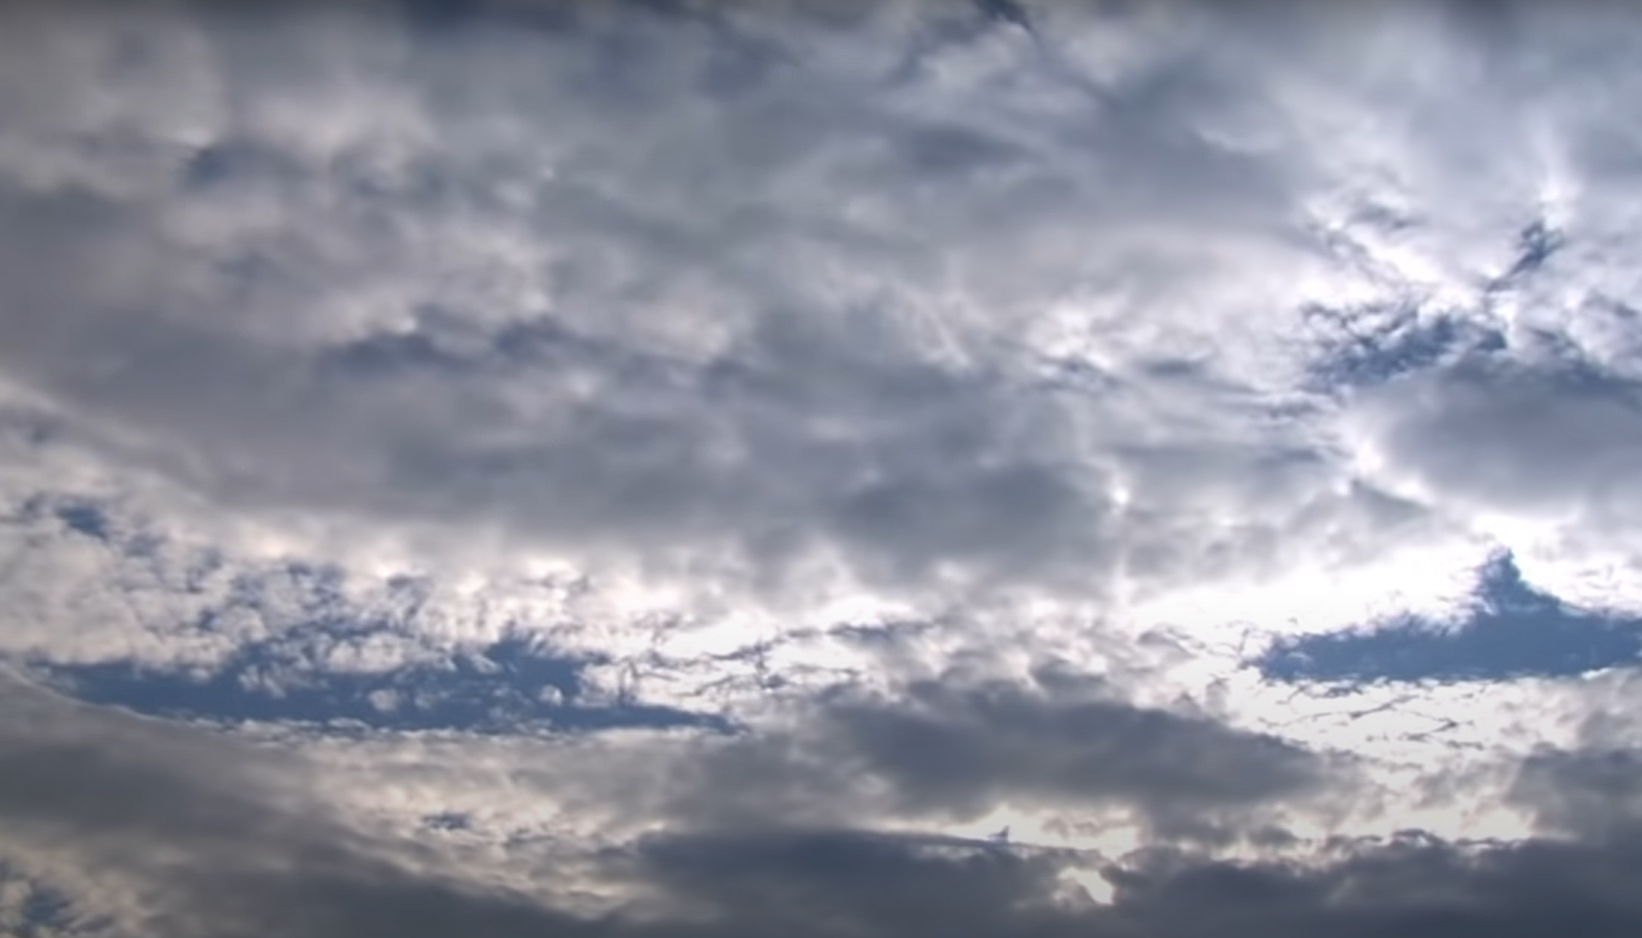
Students watch a video and answer questions on Dr. Patrick Taylor (Atmospheric Scientist, NASA Langley Research Center) as he discusses the study of clouds and Earth's energy budget by analyzing data from Low Earth Orbit satellites.
Students watch a NOVA PBS video about the different effects of clouds on climate and Earth's energy budget. Then they answer questions and brainstorm to complete a flow chart of events that might occur if the percentage of absorbing clouds increases.
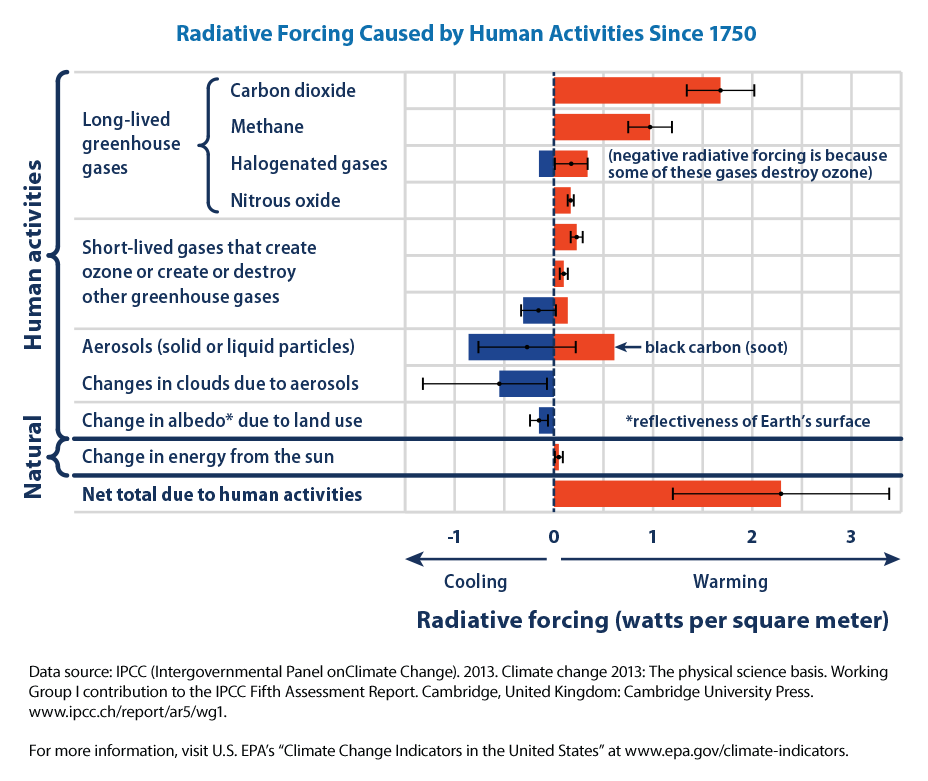
In this mini lesson, students analyze a bar graph showing the relative forcings from natural and human factors that affect Earth's climate. They use information from this graph to assess the relative importance of these factors.
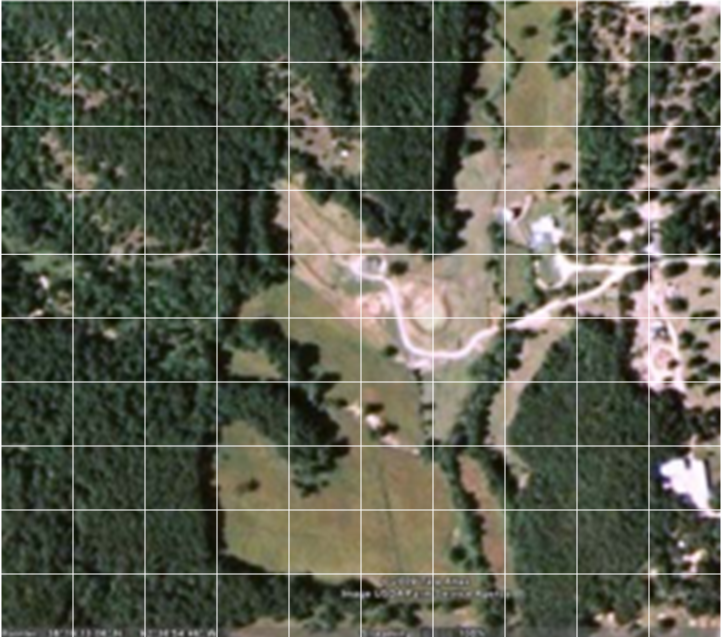
Carbon dioxide concentration in the atmosphere is affected by many processes including fires, deforestation, and plant respiration. Students will evaluate a Landsat image to determine the rate of carbon dioxide sequestration in a particular area.
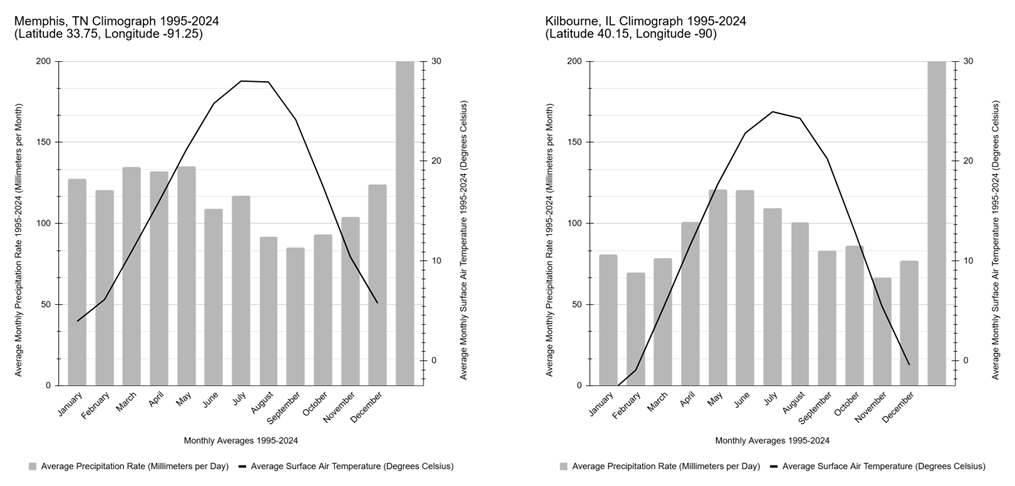
Students compare climographs for two locations to determine the most likely months to expect the emergence of mosquitoes in each location.
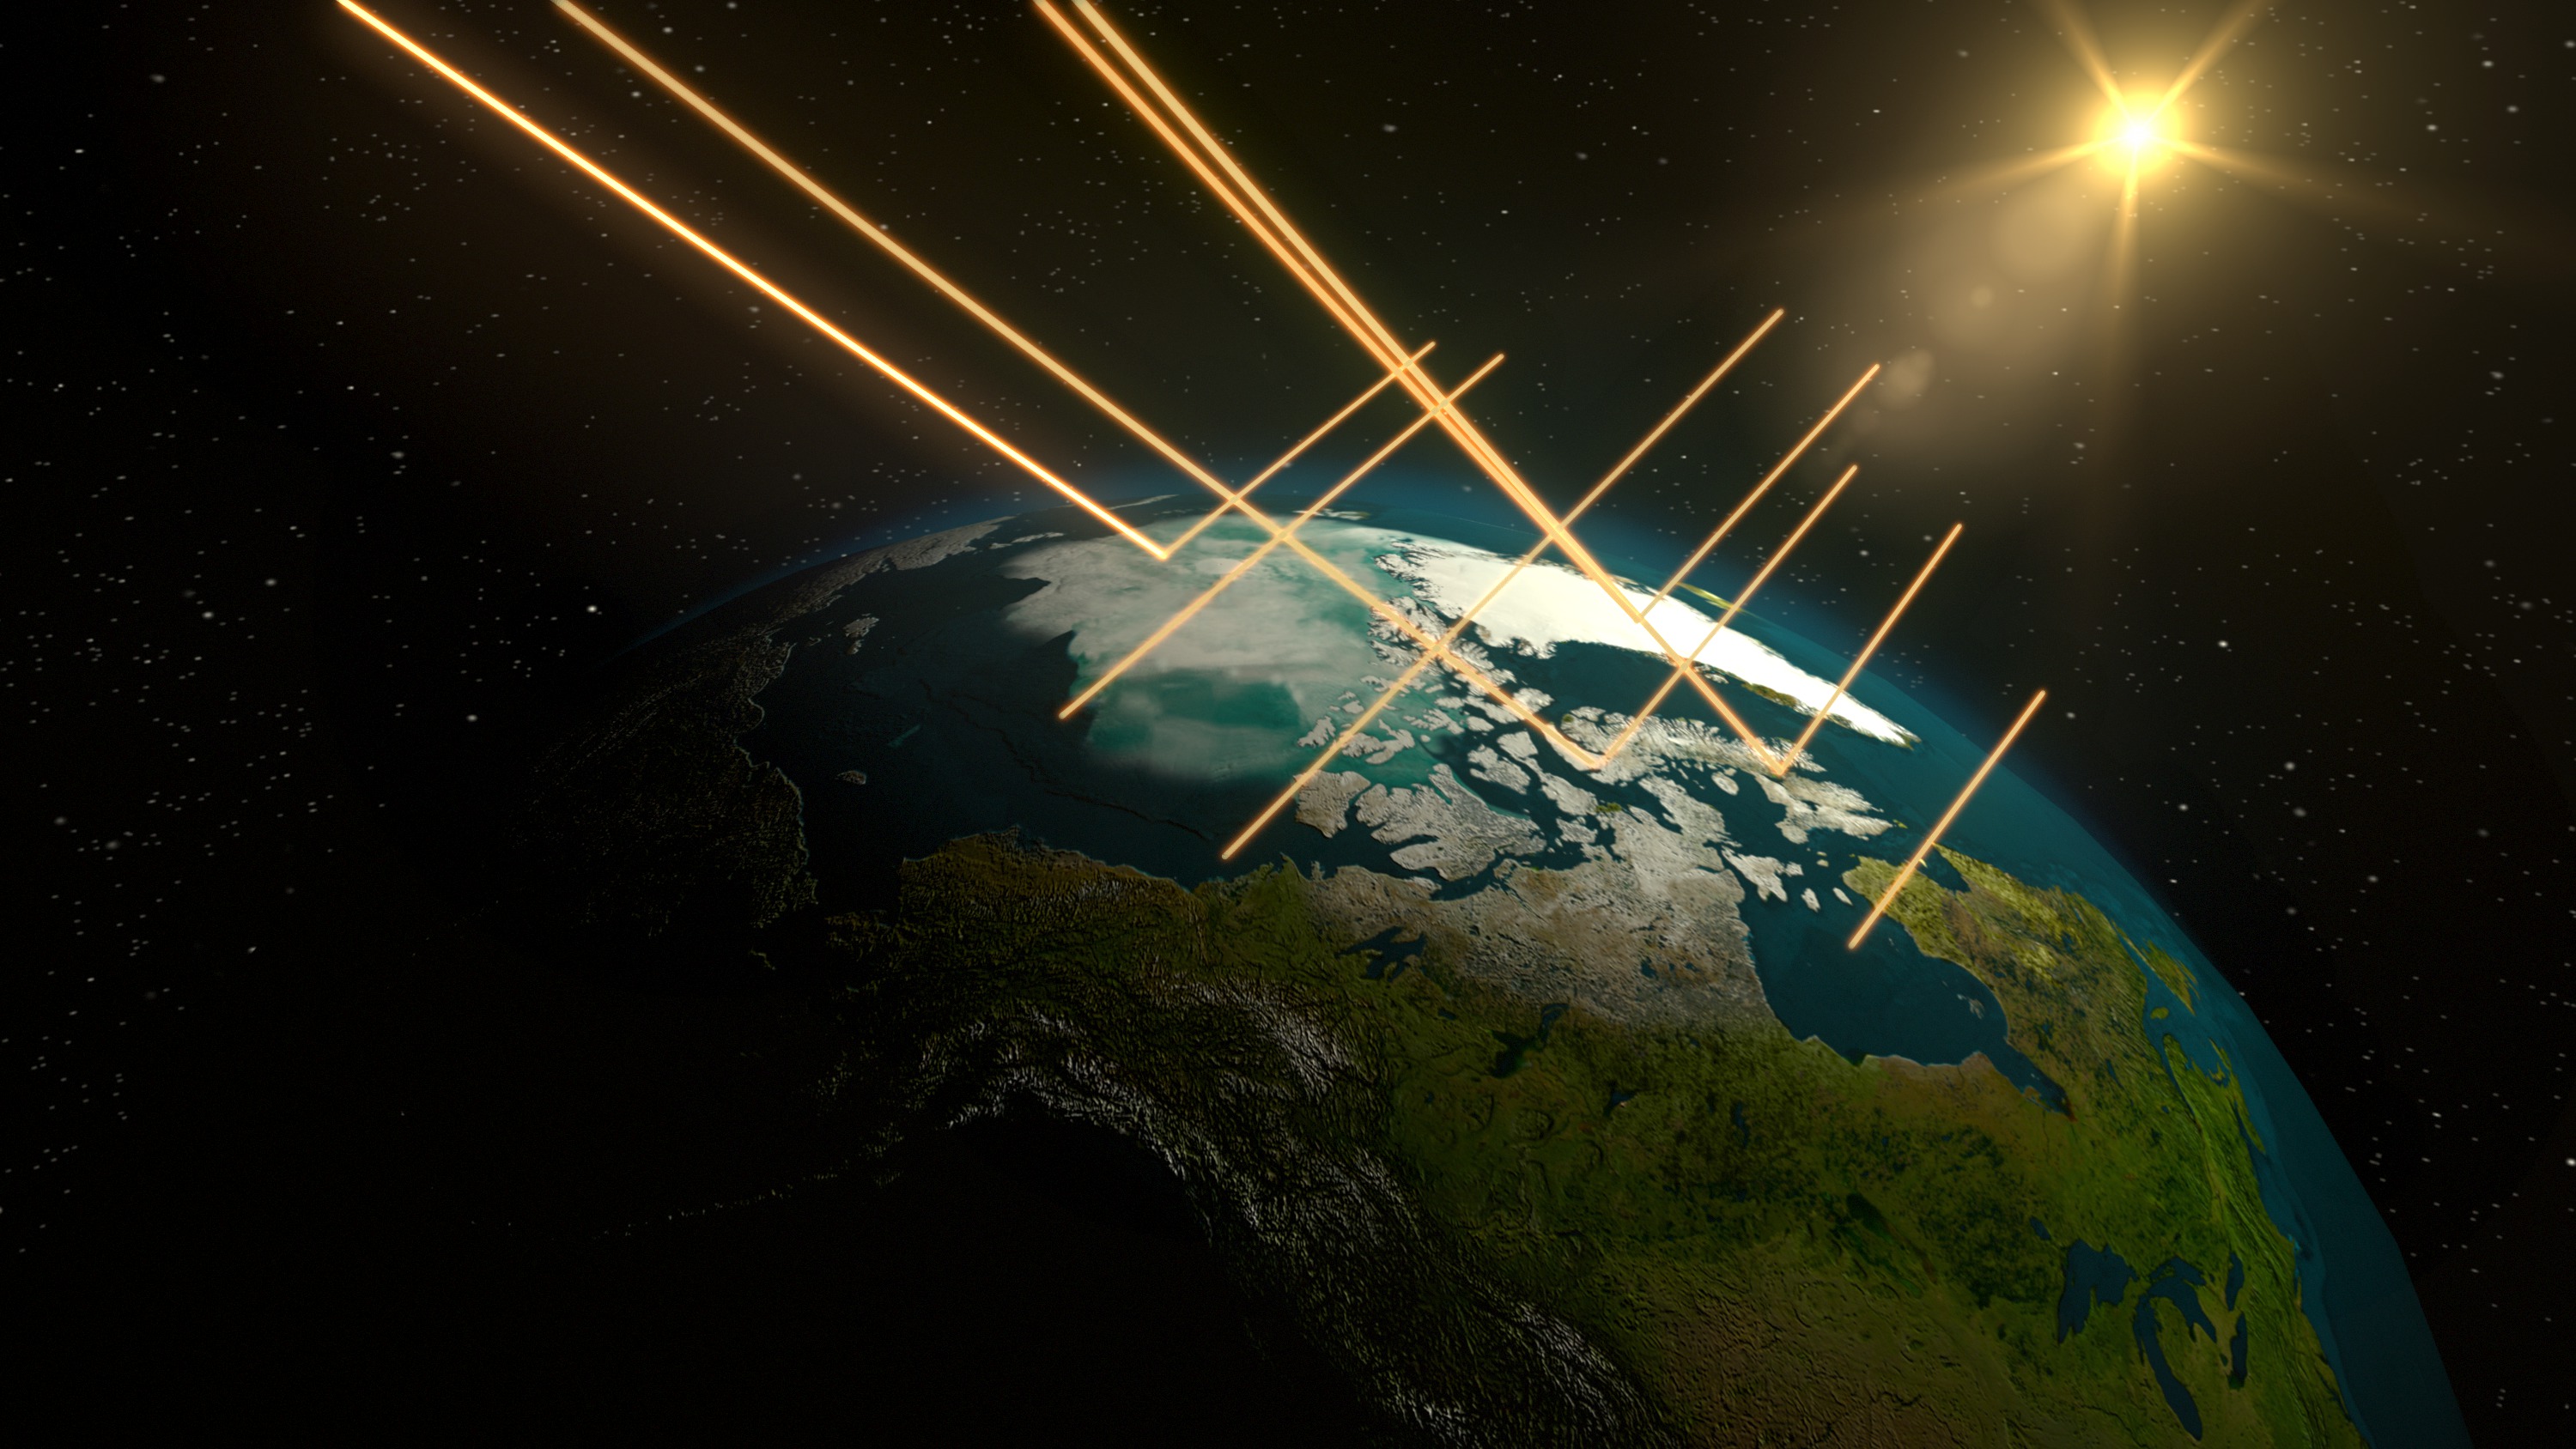
Students watch a video explaining albedo and its impact on Earth. The video shows visualizations of albedo across Earth and how it can change. Students will interpret the images in the video and answer questions about albedo.
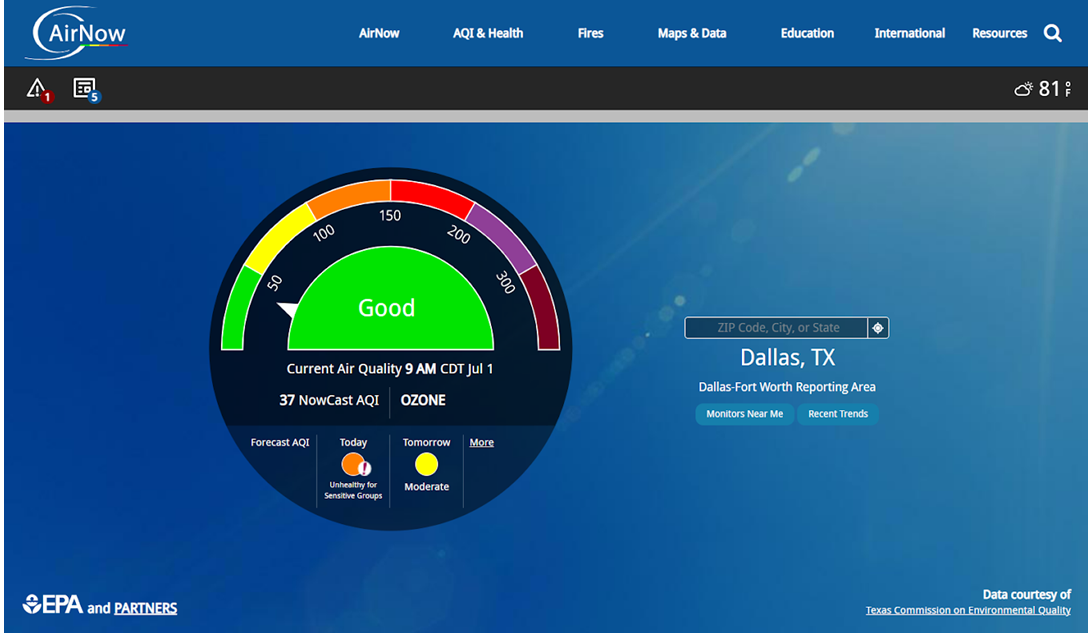
Use the AirNow.gov website to determine current air quality in US locations, as well as other information.
Students observe how air quality changes over time, for a selected location, using data from the United States Environmental Protection Agency (EPA).
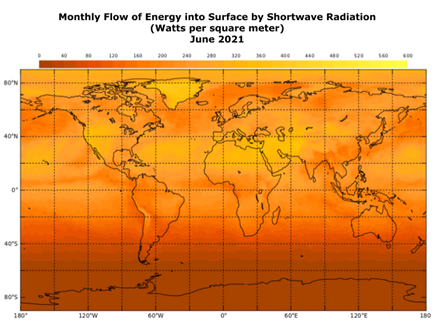
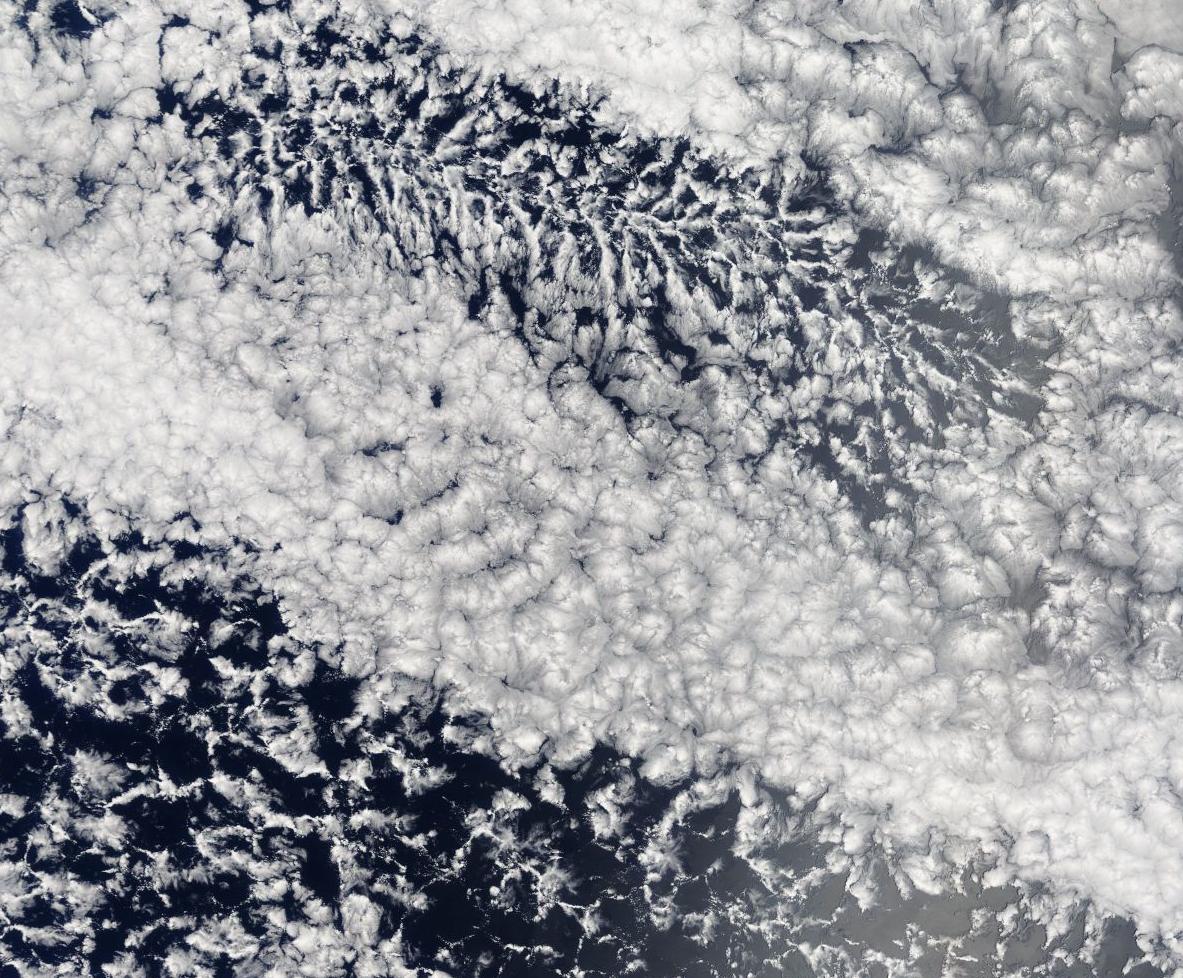
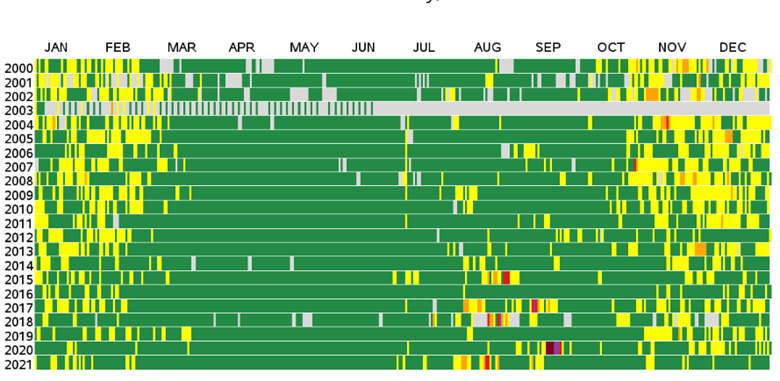
Students differentiate between data sets of monthly shortwave radiation and monthly cloud coverage to discover a relationship between radiation and clouds by answering analysis questions.
Mini lessons are intended to be short engagement activities that teachers may assign as bell-ringers, exit slips, or parts of larger learning lessons. These include activities where students interact with NASA maps, graphs, and datasets from the atmosphere, biosphere, cryosphere, geosphere, hydrosphere and the earth system.


