


Grade Level: 6-8,
9-12
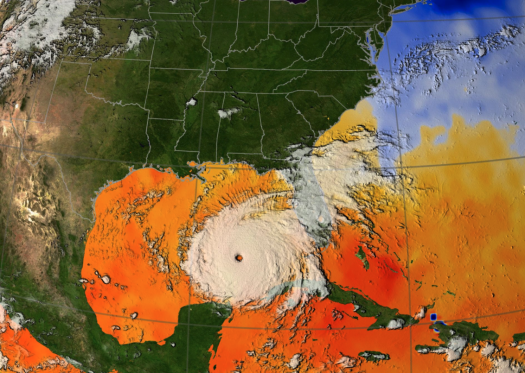
Using various visualizations (i.e., images, charts, and graphs), students will explore the energy exchange that occurs when hurricanes extract heat energy from the ocean. This StoryMap is intended to be used with students who have access to the internet in a 1:1 or 1:2 setting.