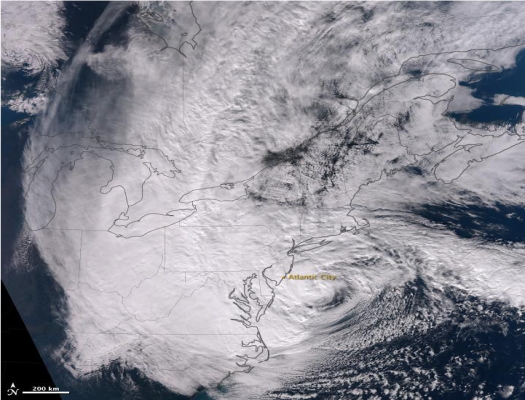
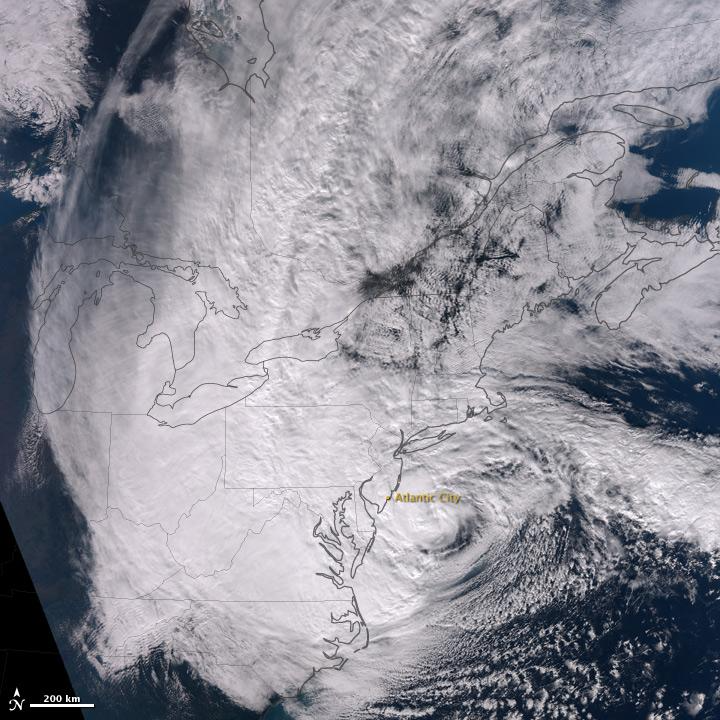
Hurricanes are large, swirling storms with winds of 119 kilometers per hour (74 mph) or higher. That's quicker than a cheetah can run which is the fastest animal on land. They are said to be the most violent storms on Earth. These storms are also called by other names, such as typhoons or cyclones, depending on where they occur.
>> Read More >>
Just one moment,
loading Atmosphere...
Featured Lesson Plans
-
-
-
Grade Level: 6-8, 9-12
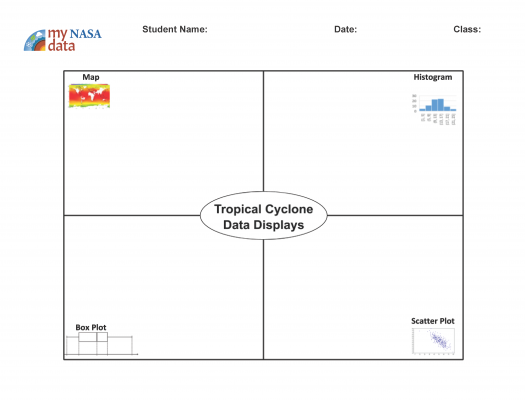
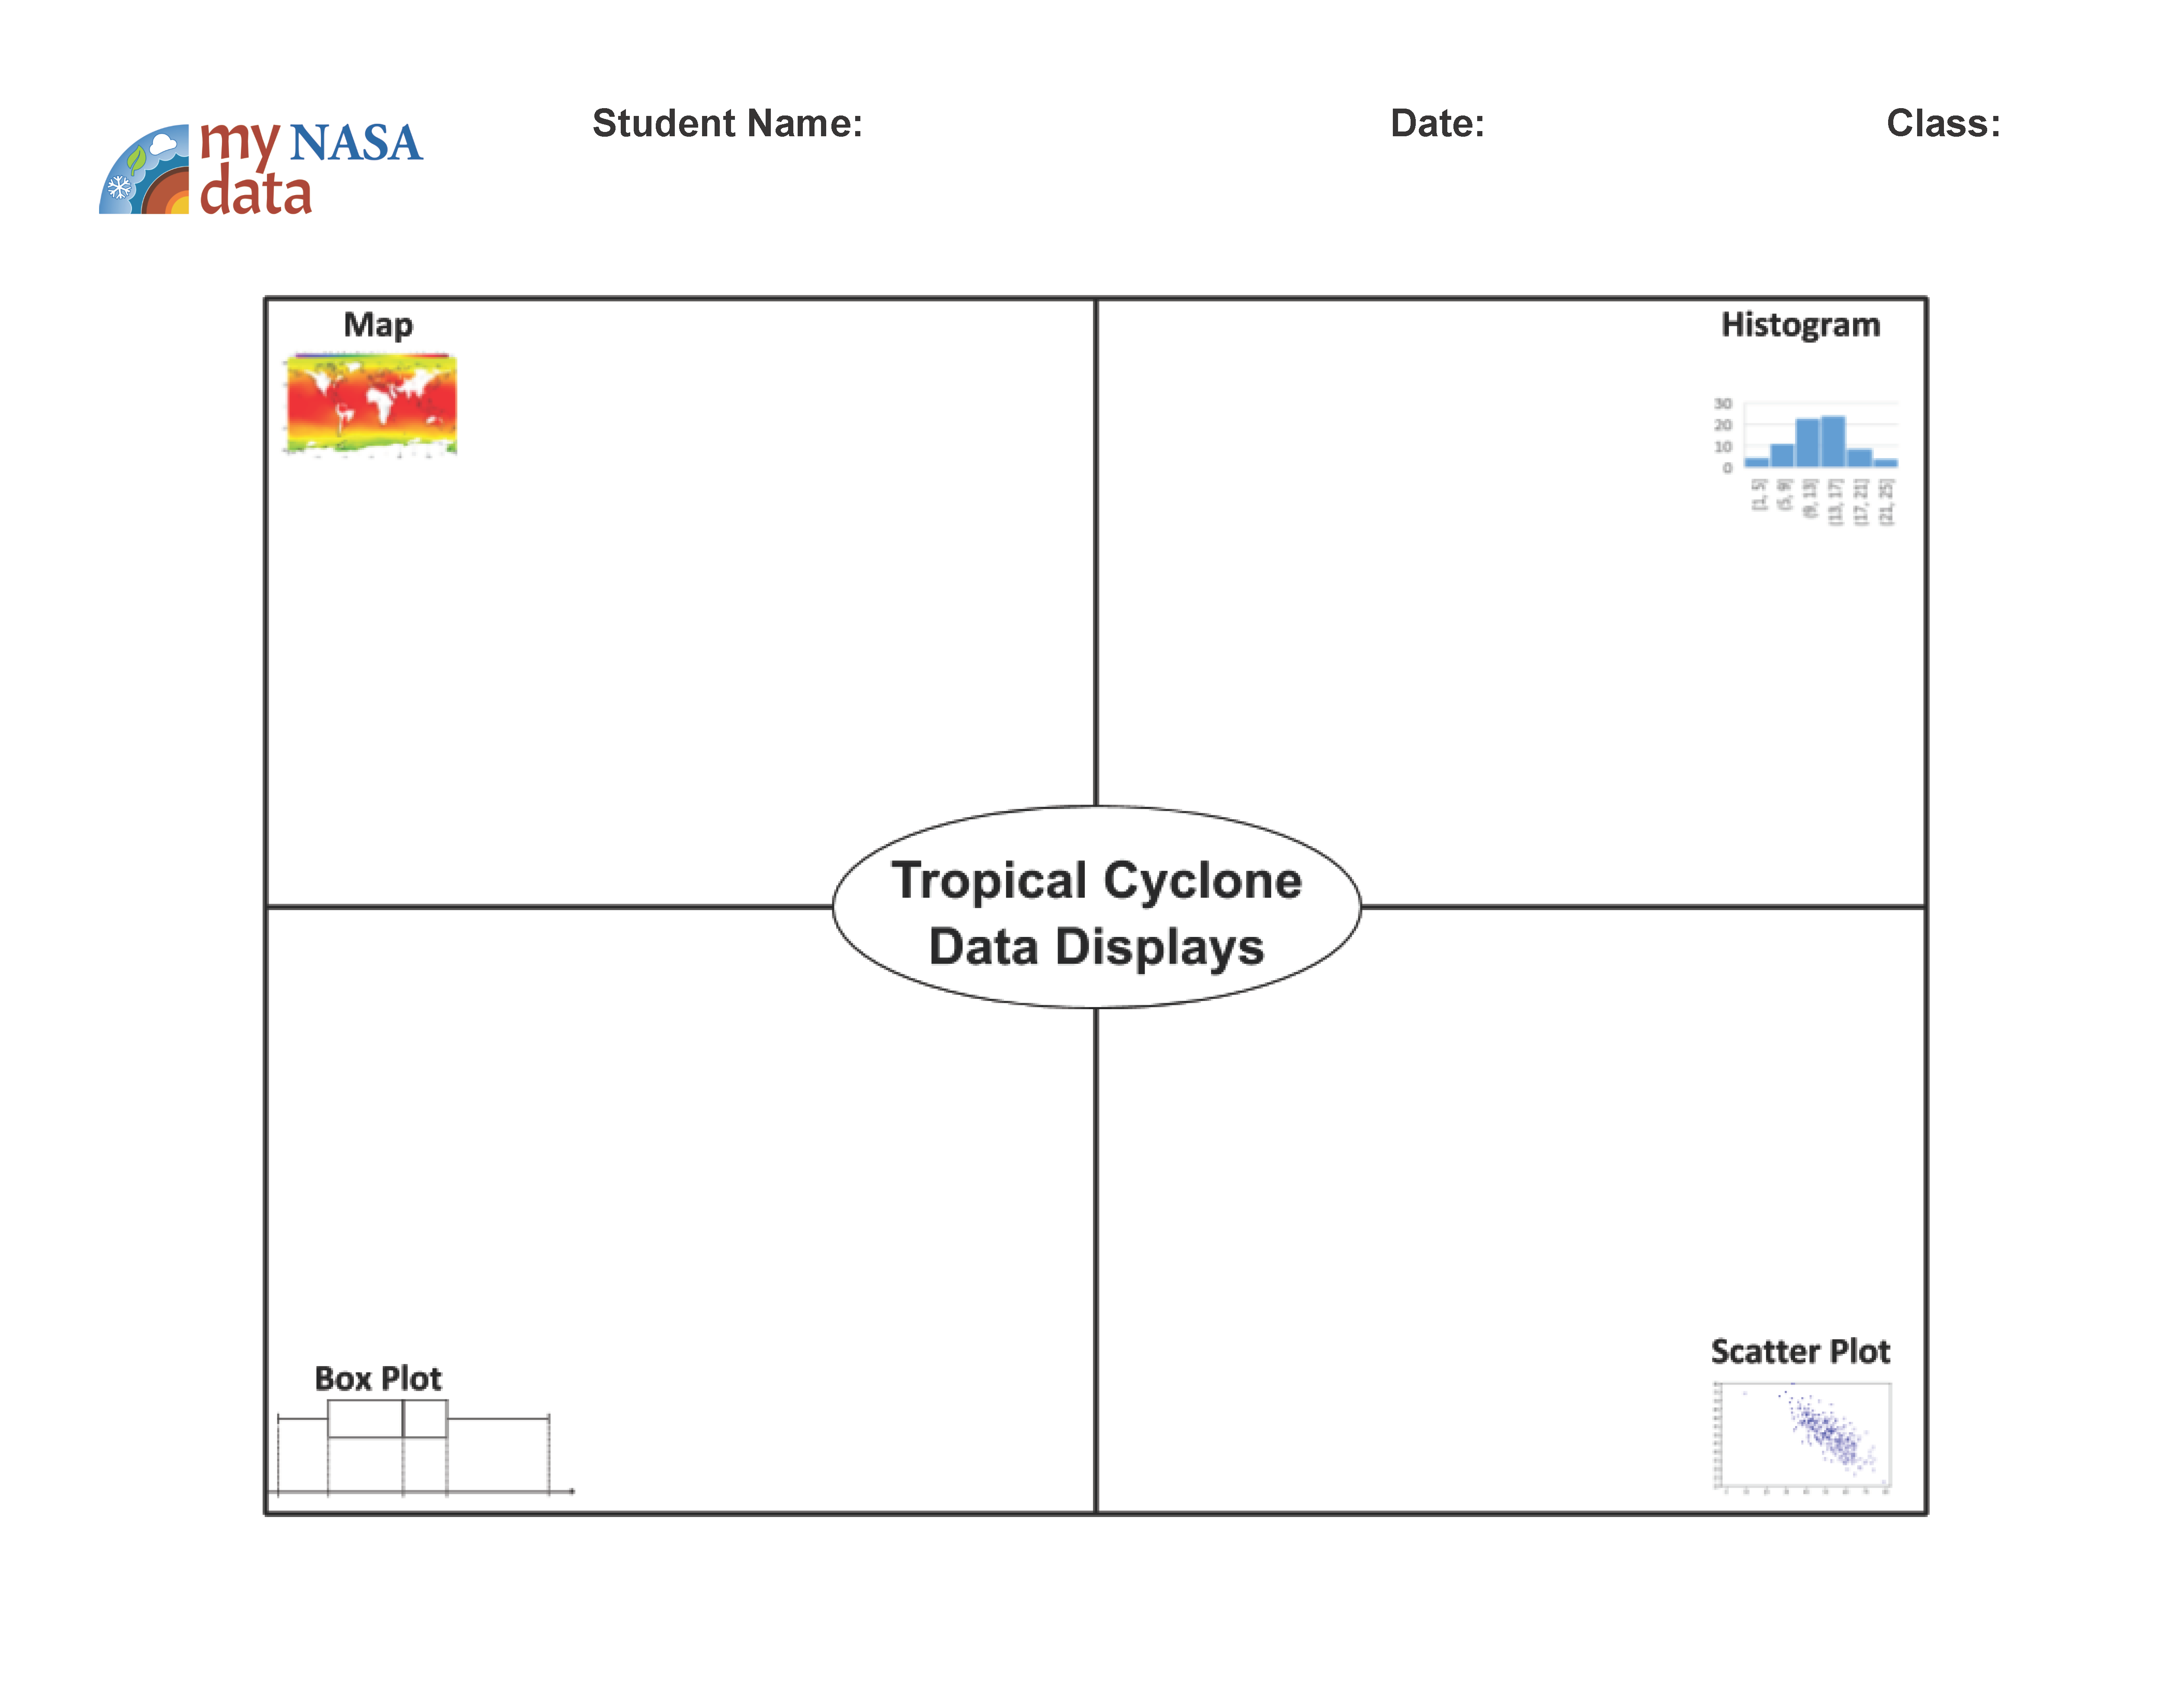
The purpose of this lesson is for students to compare data displays to determine which best answers the driving question. To do this they will evaluate the spread of the data and what the displays show.
Grade Level: 6-8
Students investigate the effects of Hurricane Sandy and make a scale model of the storm over the continental United States to assess the area of impact.
Grade Level: 3-5, 6-8, 9-12
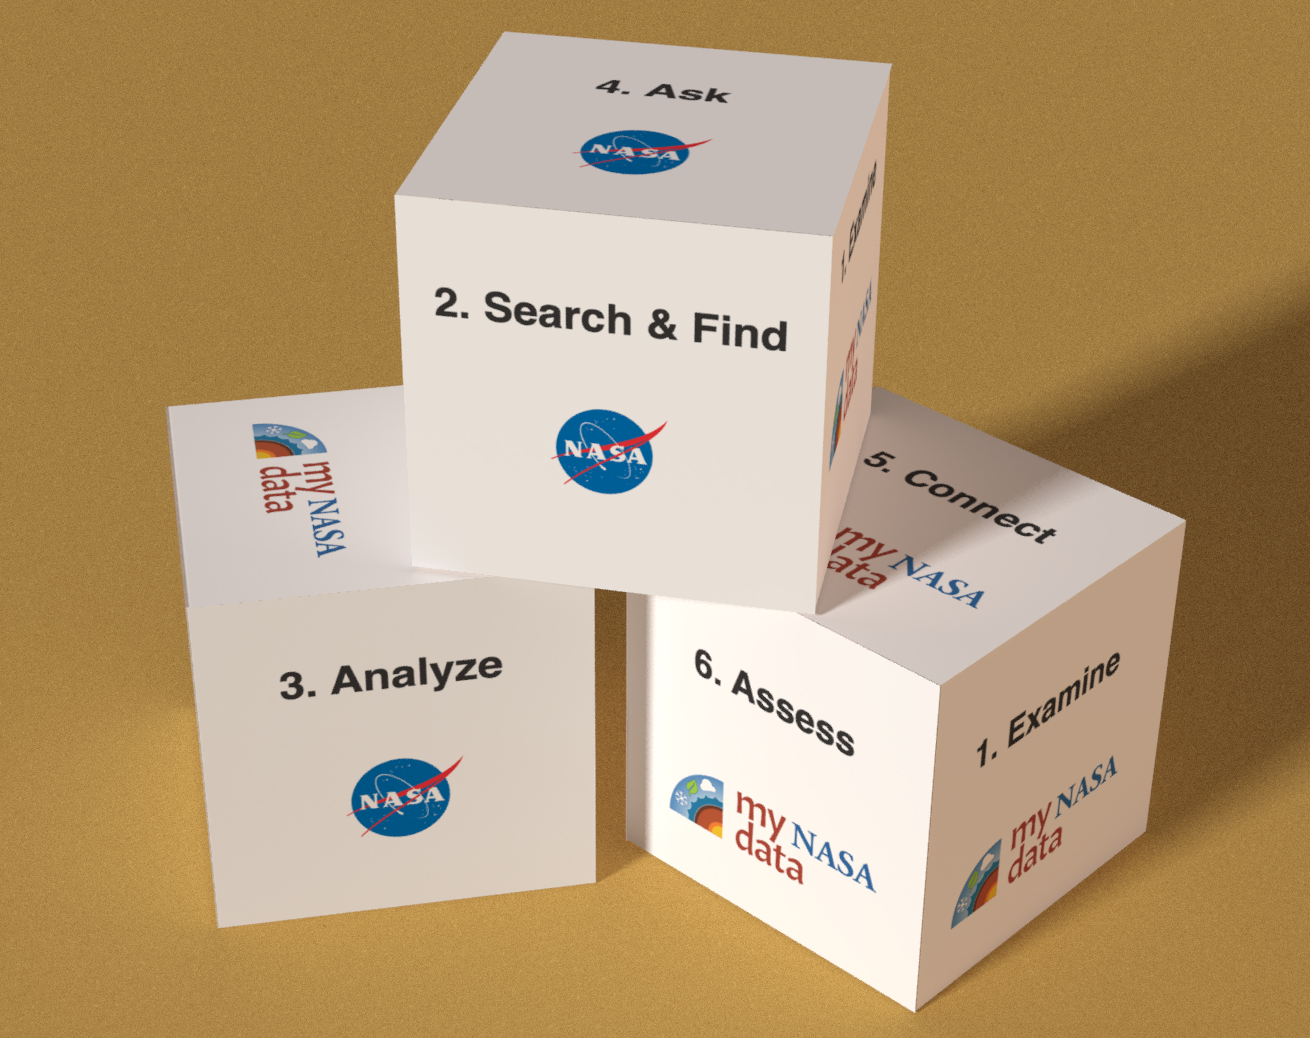
This Lesson Plan provides maps, graphs, and data tables for use with the Data Literacy Cubes. Because it is a differentiated resource, it is appropriate for multiple grade bands.
Previous
Next
Grade Level: 6-8,
9-12
The purpose of this lesson is for students to compare data displays to determine which best answers the driving question. To do this they will evaluate the spread of the data and what the displays show.
Grade Level: 6-8
Students investigate the effects of Hurricane Sandy and make a scale model of the storm over the continental United States to assess the area of impact.
Grade Level: 3-5,
6-8,
9-12
This Lesson Plan provides maps, graphs, and data tables for use with the Data Literacy Cubes. Because it is a differentiated resource, it is appropriate for multiple grade bands.
Hurricane Dynamics landing page. Explore maps, graphs, data, and related education resources. These resources include lesson plans, mini lessons, activities, and datasets for teachers and students.


