
Grade Level: 6-8,
9-12
This StoryMap lesson plan allows students to explore global phytoplankton distribution using chlorophyll concentration data in a 5 E-learning cycle.
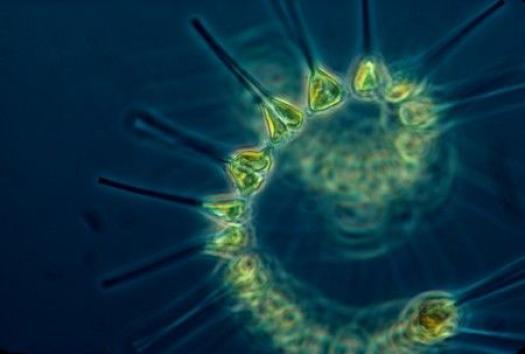
Like land plants, phytoplankton growth depends on the availability of sunlight, carbon dioxide, and nutrients. Phytoplankton are found where each of these factors are abundant. Phytoplankton live in the surface waters of the ocean, where there is usually ample light for phytoplankton to grow in the surface waters and carbon dioxide dissolved in oceans is freely available. Like land plants, phytoplankton have chlorophyll to capture sunlight, and they use photosynthesis to turn it into chemical energy (food).


This StoryMap lesson plan allows students to explore global phytoplankton distribution using chlorophyll concentration data in a 5 E-learning cycle.
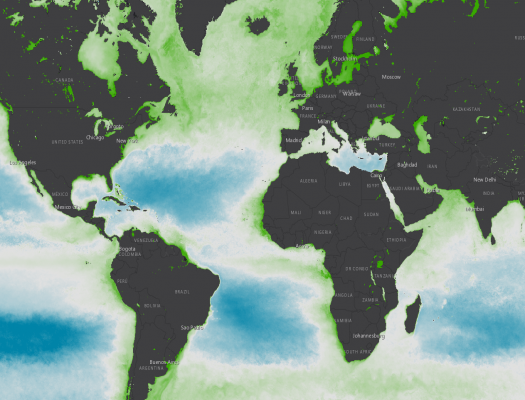
Students identify patterns in chlorophyll concentration data to formulate their explanations of phytoplankton distribution.
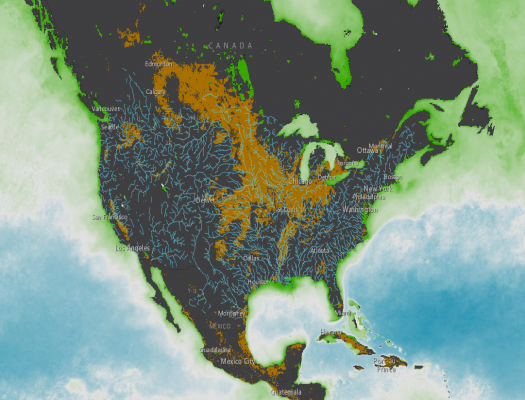
Students will identify and describe the relationship between watersheds and phytoplankton distribution.
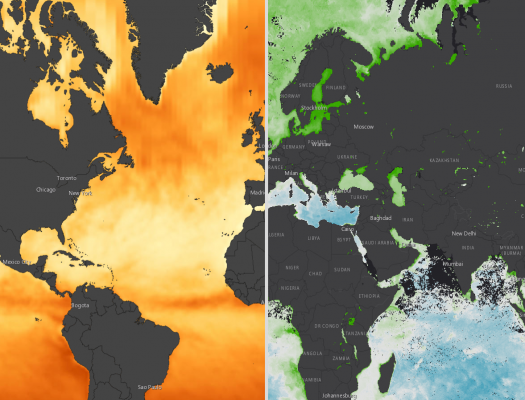
Students identify patterns and describe the relationship between chlorophyll concentration and incoming shortwave radiation.

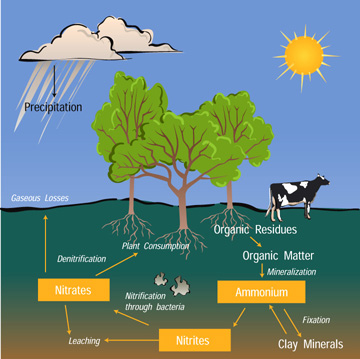
Students will explore the Nitrogen Cycle by modeling the movement of a nitrogen atom as it passes through the cycle. Students will stop in the different reservoirs along the way, answering questions about the processes that brought them to the different reservoirs.
This StoryMap lesson plan allows students to explore global phytoplankton distribution using chlorophyll concentration data in a 5 E-learning cycle.

Students identify patterns in chlorophyll concentration data to formulate their explanations of phytoplankton distribution.

Students will identify and describe the relationship between watersheds and phytoplankton distribution.
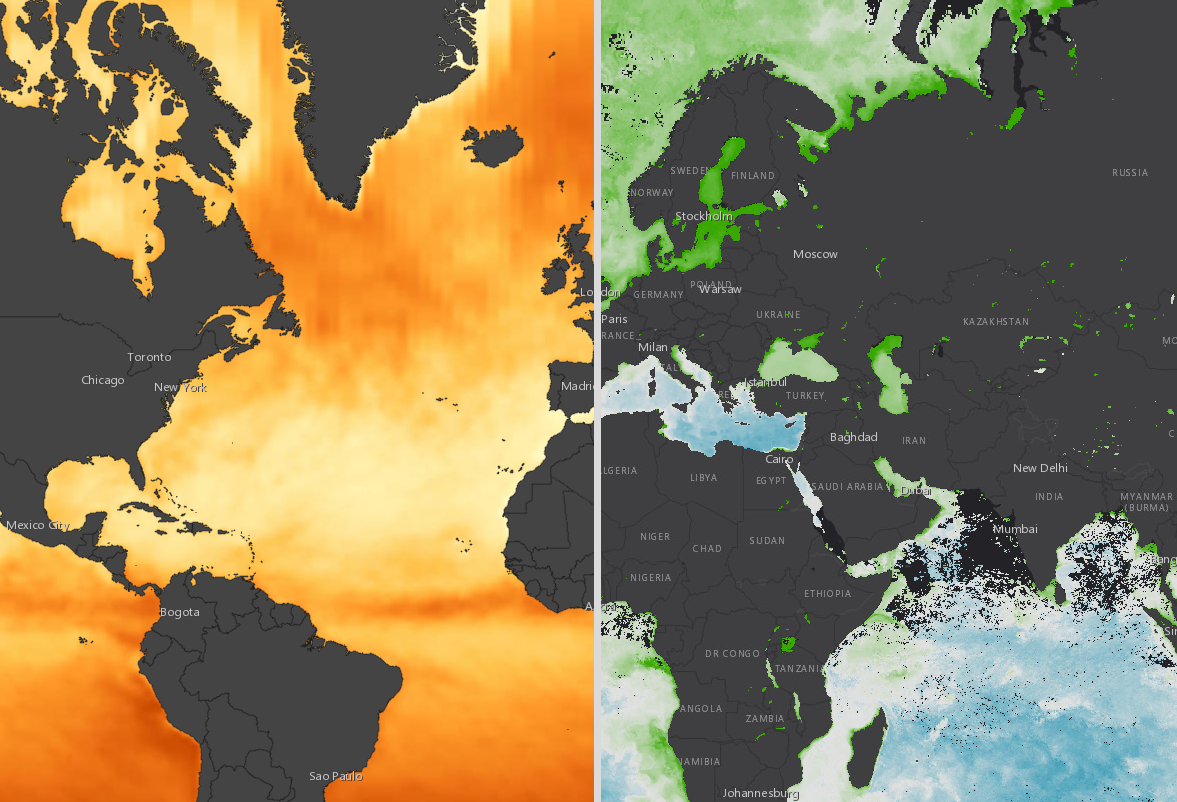
Students identify patterns and describe the relationship between chlorophyll concentration and incoming shortwave radiation.
Students will explore the Nitrogen Cycle by modeling the movement of a nitrogen atom as it passes through the cycle. Students will stop in the different reservoirs along the way, answering questions about the processes that brought them to the different reservoirs.