Interactive Models
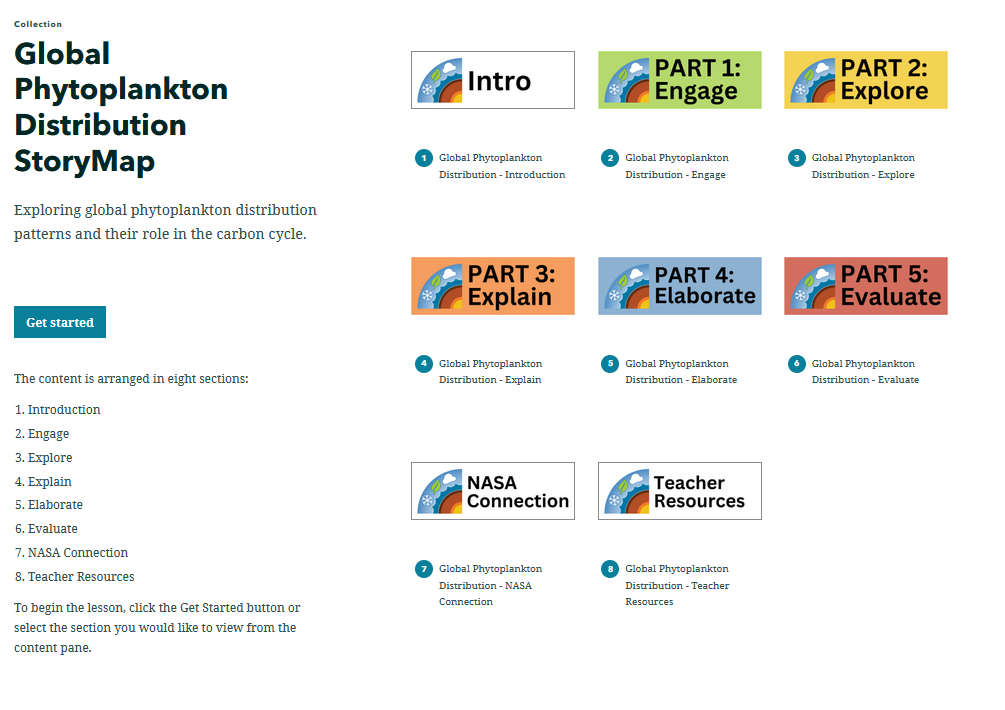
Global Phytoplankton Distribution StoryMap
Overview
Using various visualizations (i.e., images, charts, and graphs), students will explore global phytoplankton distribution using chlorophyll concentration data. Students will investigate the processes that allow phytoplankton populations to thrive, as well as how their role in the carbon cycle impacts the other spheres of the Earth System. This StoryMap is intended to be used with students who have access to the internet in a 1:1 or 1:2 setting.
![]()
Materials Required
Resources Needed Per Student:
- Student Data Sheet
- Computer/Tablet
- Internet Access
- Link to Global Phytoplankton Distribution StoryMap
Directions
- Using an internet accessible device, students open the link to the Global Phytoplankton Distribution StoryMap to begin their exploration of this phenomenon.
- Distribute the Global Phytoplankton Distribution StoryMap Student Sheet. Have students navigate on their own through the Engage, Explore, Explain, Elaborate, and Evaluate tabs of the StoryMap to answer the questions and complete the activities on their student sheet.
Teacher Note
At the bottom of the ocean's food chain, phytoplankton account for roughly half of the net photosynthesis on Earth. Their photosynthesis consumes carbon dioxide and plays a key role in transferring carbon from the atmosphere to the ocean. Unlike the plant ecosystems on land, the amount of phytoplankton in the ocean is always followed closely by the abundance of organisms that eat phytoplankton, creating a perpetual dance between predators and prey.
To learn more, visit:
- The Phytoplankton Distribution Phenomena page for background information
Teachers who are interested in receiving the answer key, please complete the Teacher Key Request and Verification Form. We verify that requestors are teachers prior to sending access to the answer keys as we’ve had many students try to pass as teachers to gain access.
Disciplinary Core Ideas:
- LS2B: Cycles of Matter and Energy Transfer in Ecosystems
- ESS2A: Earth Materials and Systems
- ESS2E: Biogeology
Crosscutting Concepts:
- Patterns
- Systems and System Models
Science and Engineering Practices:
- Developing and Using Models
- Analyzing and Interpreting Data
- Students will analyze and compare multiple variables of the Earth System as they analyze the global distribution of phytoplankton.
- Students will observe annual patterns in chlorophyll concentration and shortwave radiation.
- Students will construct explanations and conclusions using evidence.
- What conditions within the Earth System allow phytoplankton to thrive?
- How do changes in shortwave radiation affect the distribution of phytoplankton?
- What affect do sea surface temperature and ocean currents have on distribution of phytoplankton?
- How does chlorophyll concentration indicate the presence of phytoplankton?
- How do phytoplankton contribute to the carbon cycle?
National Geography Standards:
- How to use maps and other geographic representations, tools, and technologies to acquire, process, and report information from a spatial perspective.
- Internet Required
- One-to-a-Group


Document Resources
Interactive Files
Grade Band
- 6-8
- 9-12
Time
- > 90 minutes
Visualization Tool
NGSS Three Dimensional Learning
- See drop-down menu at the bottom of the page