Lesson Plans
What Color is the Ocean? A STEM Spectrophotometer Activity
Overview
In this activity, you will use an inexpensive spectrophotometer* to test how light at different visible wavelengths (blue, green, red) is transmitted, or absorbed, through four different colored water samples. Clear water is used as the “control,” characterizing the light source and normalizing the other samples. The blue water represents the open ocean water with few plants—conditions you might find far from land in the middle of the ocean. The green water represents productive water with a high concentration of phytoplankton, i.e., a phytoplankton bloom. The tea water represents coastal water or river outflow that contains decaying organic material such as leaves.

*Note that a laboratory spectrophotometer is more sensitive than the one used in this activity.
Materials Required
- Activity Sheet
- littleBits(TM) components or their equivalents:
- 2x battery + cable
- 2x power bit
- 3x rgb LED
- 3x wire
- 1x light sensor
- 1x number output
- littleBits(TM) components or their equivalents:
- Two 9V batteries
- Four square, clear containers of clean tap water
- Blue and green food coloring
- Cooled tea
- Three colored pencils: blue, green, red
- Calculator
- Black cloth to cover water sample and minimize ambient light
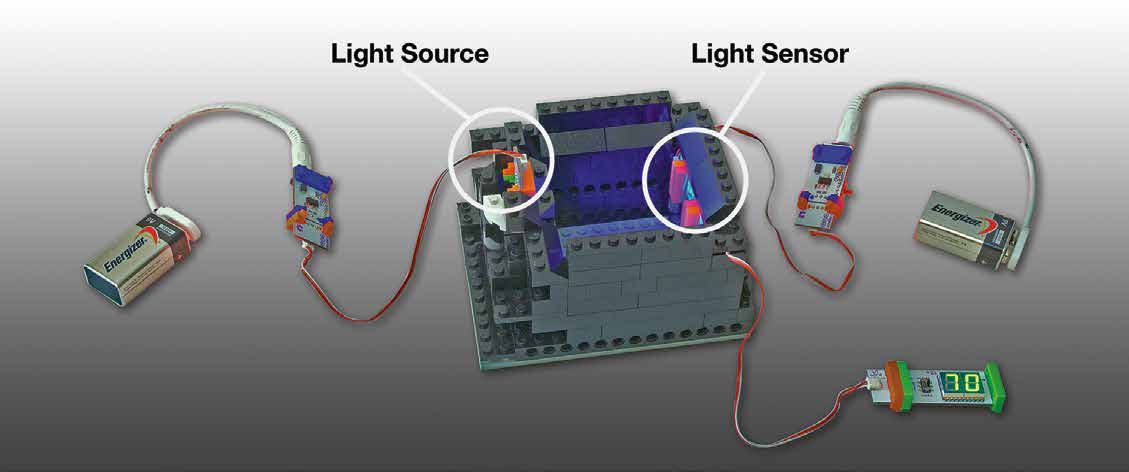
- A black base into which the square water containers fit. You should be able to secure the LED light(s) on one side of the base and the light sensor directly across—see photo below Note: A simple Lego® structure is used.
Procedure
Preparation:
Prepare four, square containers of water. One container should contain only clear water. For the other three containers: Put one drop of blue food dye in one, one drop of green food dye in another, and some tea (no leaves) in the last. Mix each container well.
Build the Sensor:
1. Build a light sensor with battery + power + orange wire + sensor + number display—see Materials Guide.
2. Put together a light source with power + bright LED. Make sure you have three properly tuned* LED light sources (blue, green, red).
- * Tune one LED light to red (tune up “r” with the littleBitsTM screwdriver, tune down “g” and “b”), tune one LED to green (tune up “g,” tune down “r” and “b”), and tune one LED to blue (tune up “b,” tune down “r” and “g”). Make sure the LED light is not too bright. To do this, adjust the three light sources and/or the sensitivity of the detector so that the light sources put out distinct colors and read up to 98 when transmitted through clear water. Keep the same settings for the entire experiment.
3. Attach the light sensor to one side of the black base and place the blue LED light source on the opposite side of the black base. The light source should be level with (and shining directly on) the light sensor on the opposite side of the black base.
4. Put the clear water sample into the black base and turn on the blue LED light so that the blue light shines through the container of clear water and is received by the light sensor on the opposite side. Cover the spectrophotometer (black base, light sensor, and light source) and water sample with a black cloth to minimize background light.
Collect Data:
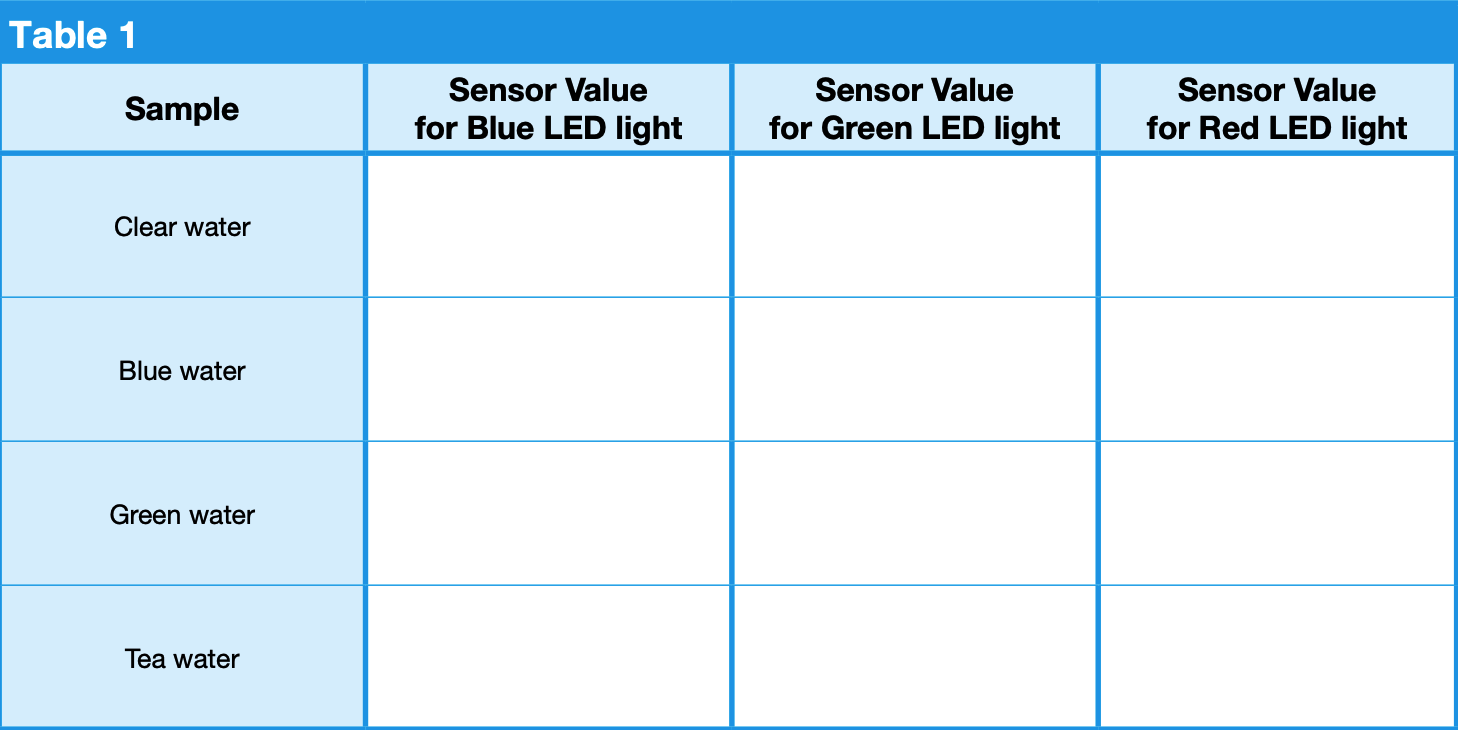
1. Record the value on the light sensor (received by the blue LED light) for clear water in Table 1. Remove the blue LED light. Insert the green LED light and record the value on the light sensor for clear water in Table 1. Remove the green LED light. Insert the red LED light and record the value on the light sensor for clear water in Table 1. Repeat for all colored water samples (blue, green, tea), completing Table 1.
Analyze Your Data:
- Circle the highest sensor value for each colored water sample in Table 1. Do you notice a pattern?
-
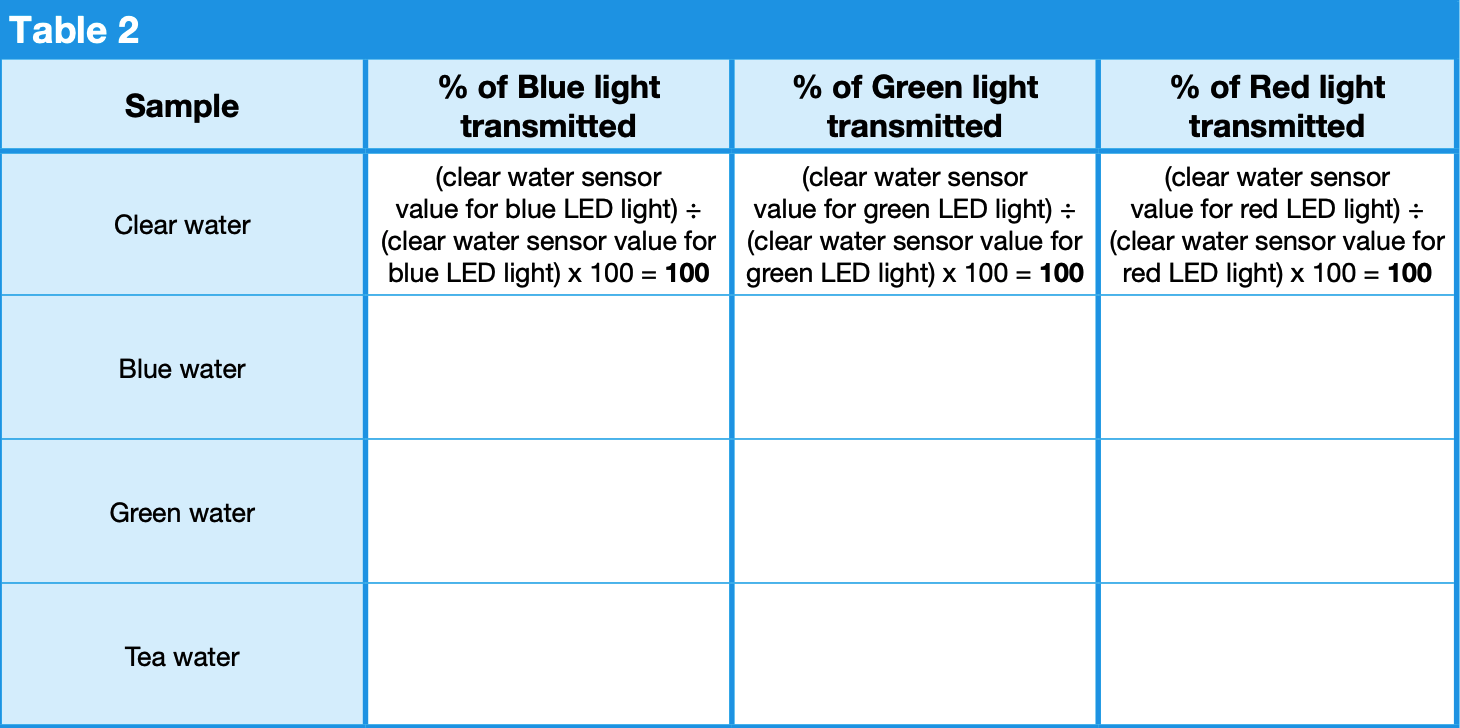
Calculate the percent of light transmitted for each colored water sample in Table 2. To do this, divide each colored water sensor value from Table 1 by the clear water sensor value for the corresponding light color and multiply that value by 100 to get the percentage of light transmitted. For example, (blue water sensor value for blue LED light) ÷ (clear water sensor value for blue LED light) x 100 = (percentage of blue light transmitted). Calculate and record each percentage in Table 2.
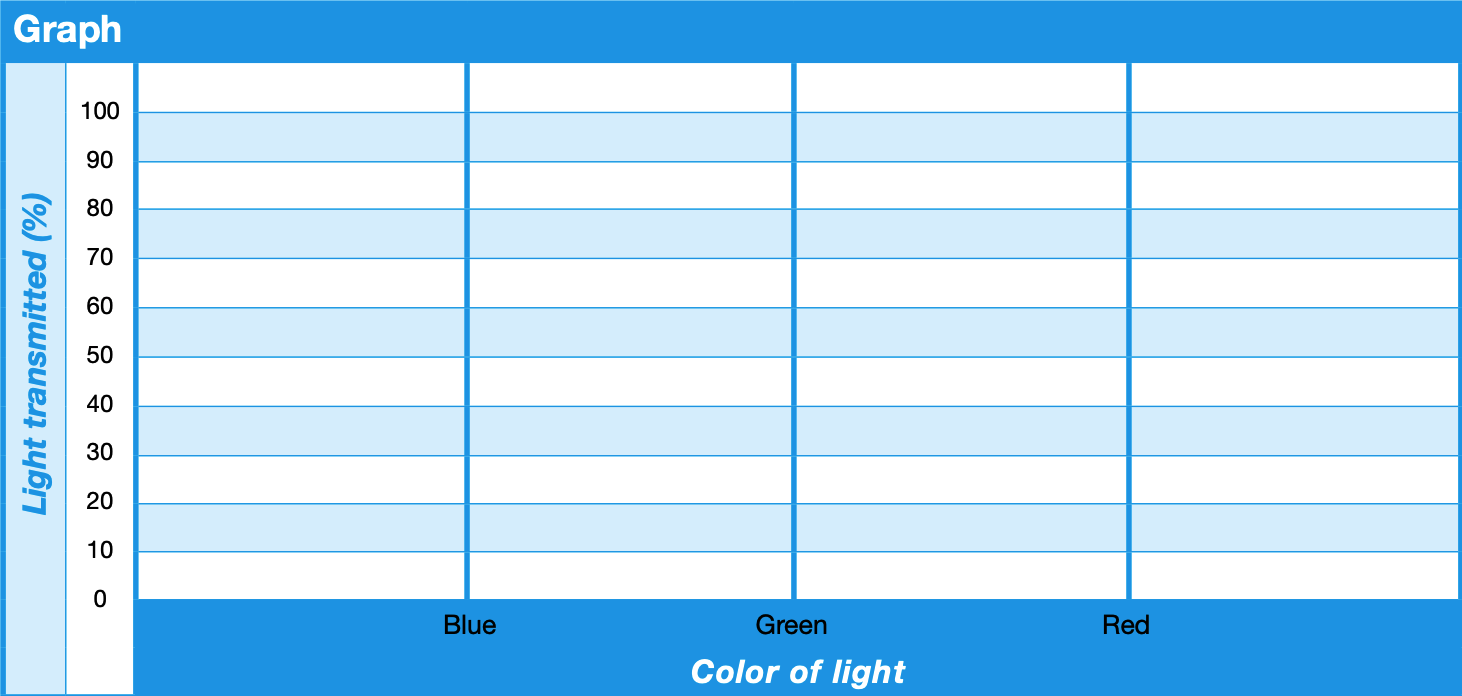
- Plot the values from Table 2 on the Graph for all three colored water samples (blue, green, red) using three corresponding colored pencils (blue, green, red).
-
Discuss the results revealed in Table 2 and the Graph.
Discussion the Results:
- Engage students in summarizing their findings.
- The color of the water affects how much light from the light source is transmitted or absorbed before reaching the light sensor. Specifically, the spectrum (i.e., graph) for each colored water sample demonstrates that the highest percentage of light transmitted through a medium corresponds most closely to the color of its constituents while the other colors are absorbed. In other words, the blue water transmits the highest amount of blue light and absorbs green and red light. Likewise, the green water spectrum peaks at green and the tea water spectrum peaks at red. These are called spectral signatures.
- While ocean color satellite sensors measure reflected light—not light that is transmitted across a water sample like a spectrophotometer does—scientists are able to remotely sense the same spectral signatures, allowing them to observe and analyze changes in ocean color.
Disciplinary Core Ideas:
- PS4B: Electromagnetic Radiation
- LS2B: Cycles of Matter and Energy Transfer in Ecosystems
- ESS2A: Earth Materials and Systems
- ESS3A: Natural Resources
Crosscutting Concepts:
- Cause and Effect
Science and Engineering Practices:
- Developing and Using Models
- Planning and Carrying out Investigations
- Analyzing and Interpreting Data
- Using Mathematics and Computational Thinking
- Constructing Explanations and Designing Solutions
- Build a sensor to test how light at different wavelengths is transmitted or absorbed
- Collect data on the sensor value for different colored water samples
- Calculate the percent of light transmitted for each sample
- Graph data
- What color is our ocean?
- Why is the color of the ocean water important?
- How do we observe and measure water's color?
What Color is the Ocean?
The color of an object is actually the color of the light reflected while all other colors are absorbed. Most of the light that is reflected by clear, open ocean water is blue, while the red portion of sunlight is quickly absorbed near the surface. Therefore, very deep water with no reflections off the sea floor appears dark navy blue. Near the Bahama Islands however, where the water is clear but also shallow, sunlight is reflected off white sand and coral reefs near the surface, making the water appear turquoise. There are many places on Earth where water is not deep or clear, and therefore, not always blue. Suspended particles and dissolved material in water increase the scattering of light and absorb certain wavelengths differently, influencing the color of the water. For example, phytoplankton are microscopic marine plants that use chlorophyll and other light-harvesting pigments to carry out photosynthesis. Chlorophyll is a green pigment that absorbs the red and blue portions of the light spectrum and reflects green light. Ocean water with high concentrations of phytoplankton can appear as various shades of green, depending upon the type and density of the phytoplankton population. Other types of algae can make water appear reddish or deep yellow. Near coastal areas, dissolved organic matter, such as decaying plants, can produce a yellow or brown color. Soil runoff produces a variety of yellow, red, brown, and gray colors.

Why is Ocean Color Important?
Scientists use ocean color data to study:
- fundamental questions about phytoplankton blooms, the aquatic food web, and fisheries;
- the storage of carbon in the ocean and the role of the ocean in Earth’s climate; and
- ocean health and water quality to assist resource managers.
Phytoplankton can be the harbingers of death or disease. Certain species of phytoplankton produce powerful toxins, making them responsible for harmful algal blooms, sometimes called "red tides". Toxic blooms can kill marine life and people who eat contaminated seafood.
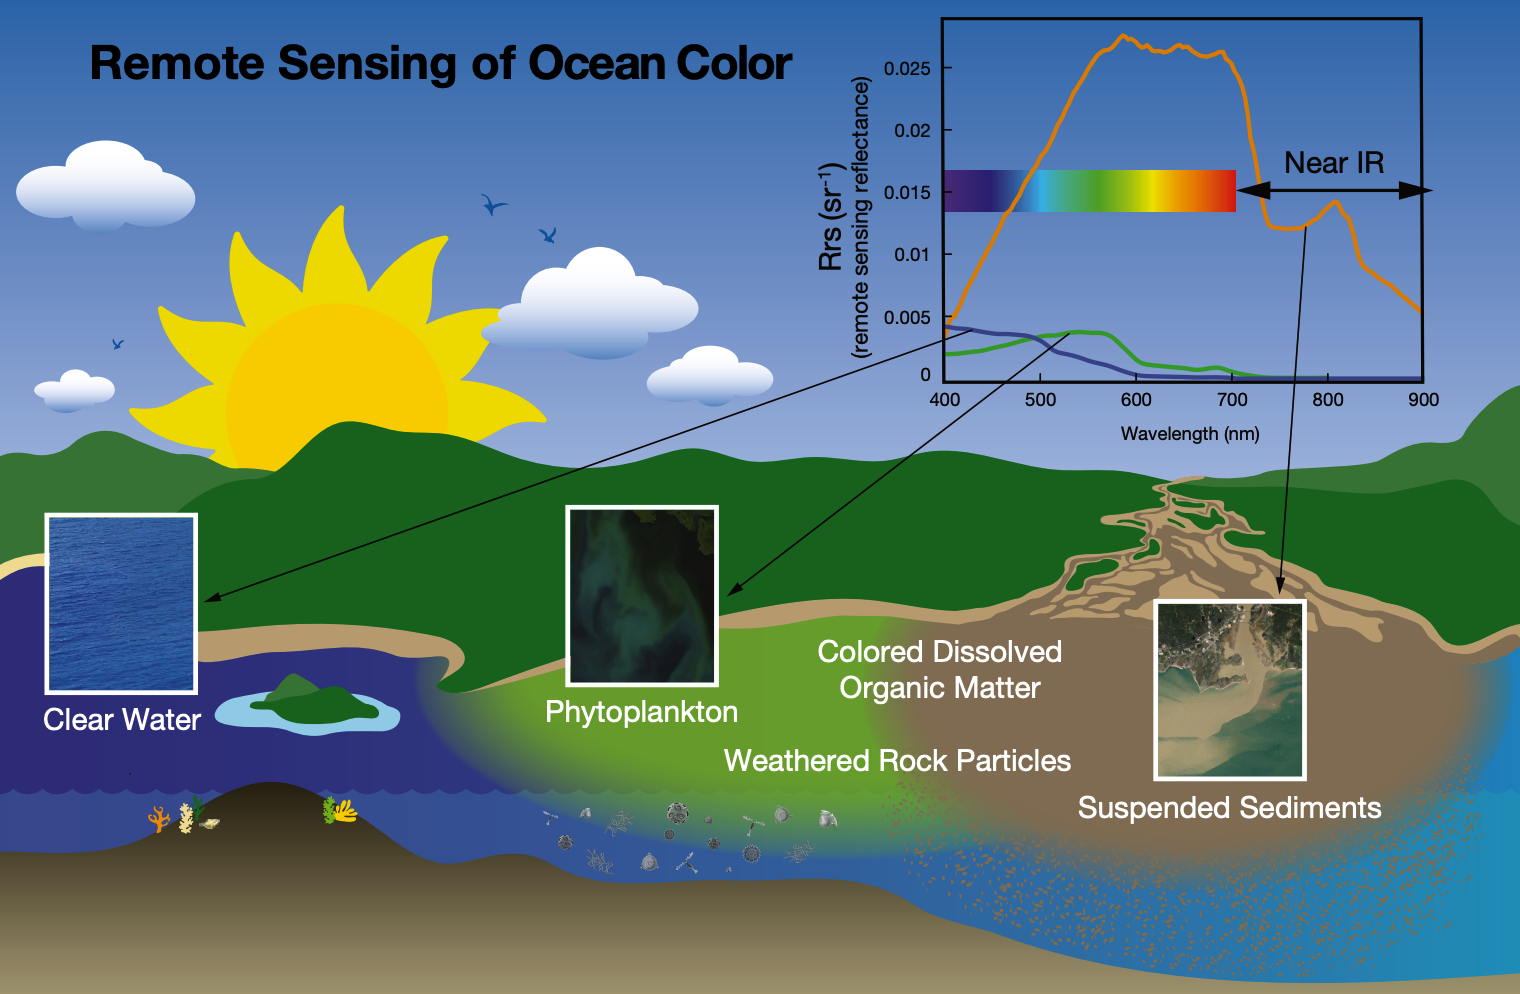
Scientists use a technique similar to spectrophotometry to quantify ocean color remotely. Satellite instruments (such as OCI) measure light reflected back to the satellite at different wavelengths and create emission spectra graphs [inset, top right]. Differences in the shape of the spectra can be used to determine what is in the water, such as sediments (orange line), chlorophyll (green line), or clear water (blue line). Brighter objects (e.g., sediments) reflect more light of all wavelengths while darker objects absorb more, thus the values are higher across the spectrum for sediment.
- Photosynthesis
- Circuits
- Phytoplankton are too small to be important—trees win.
- Algae (phytoplankton) are plants
THE OCEANOGRAPHY CLASSROOM • 110 Misconceptions About the Ocean
Feller, R.J. 2007. Education: 110 misconceptions about the ocean. Oceanography 20(4):170–173, https://doi.org/10.5670/oceanog.2007.22.
Measuring Ocean Color: At Sea and From Space
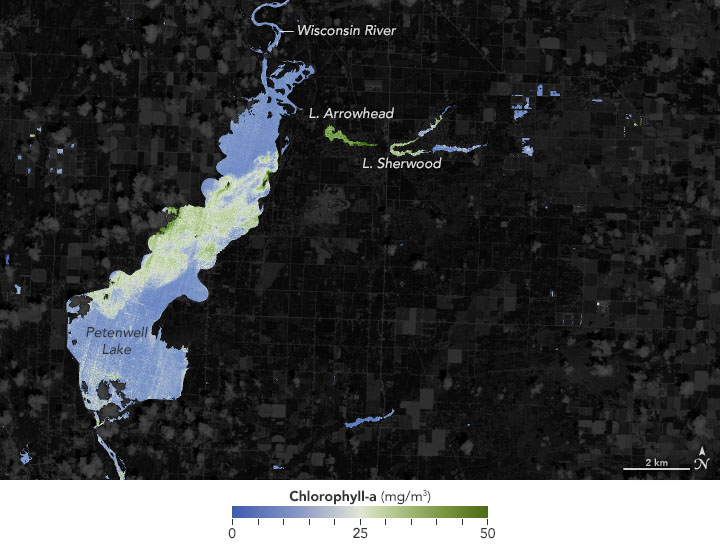
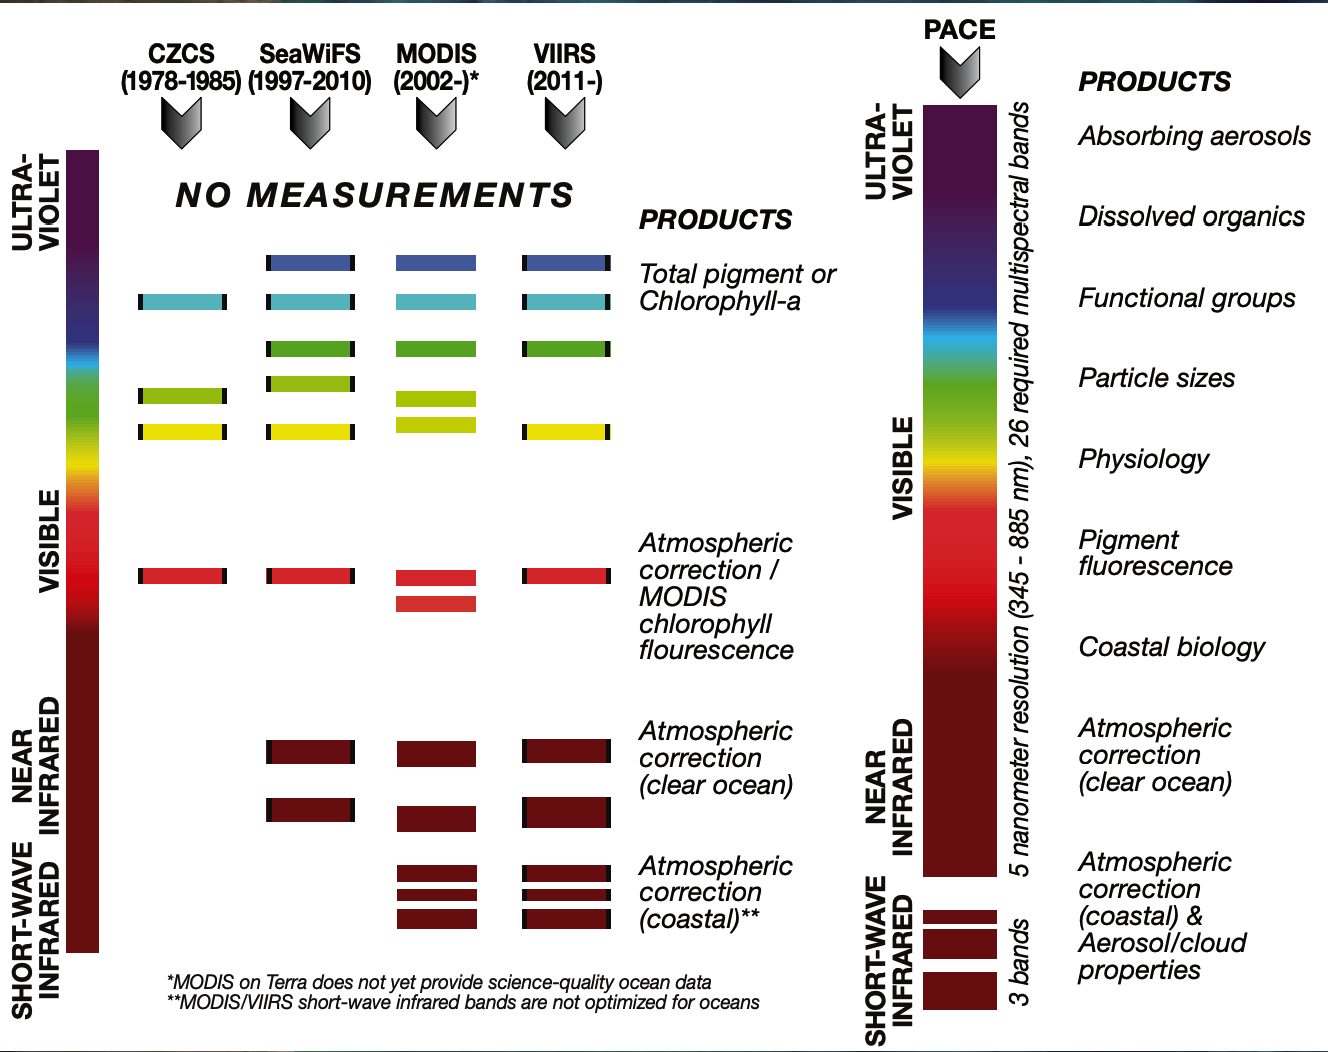
NASA Scientists can measure ocean color directly—by taking water samples from ships and permanent observation sites— or indirectly—using Earth-observing satellites that measure the amount of light backscattered and reflected from Earth’s surface at various wavelengths. Unlike patchy ship-based measurements, satellites provide continuous global coverage over long timescales.NASA plans to launch the Plankton, Aerosol, Cloud, ocean Ecosystem (PACE) mission in 2022. The Ocean Color Instrument (OCI) onboard PACE will provide the most advanced, continuous global observations at high-spectral resolution from the ultraviolet (UV) to near infrared (i.e., 350 – 800 nanometers), plus several short-wave infrared (SWIR) bands. PACE’s broad spectral coverage will unveil a variety of new products to aid our understanding of the ocean as well as the atmosphere. Over the ocean, UV data will help discriminate between living and non living components of the upper ocean. Visible wavelengths will be used to identify the composition of phytoplankton communities.
Spectral Coverage
This graph compares the portions of the electromagnetic spectrum that the PACE Ocean Color Instrument will observe compared to previous NASA ocean color sensors. Human eyes are adapted to see a narrow band of this spectrum called visible light. Using satellite sensors to detect multiple spectral band combinations, scientists can study various aspects of ocean color in ways that they cannot from a photograph. Ocean color features, clouds, and aerosols each leave their signatures in the electromagnetic spectrum and scientists can observe and analyze these patterns to detect changes.
- Molecular and Cellular Biologist - Study cellular molecules and organelles to understand cell function and organization.
- Marine Biologist/Biological Oceanographer - research biological oceanography and the associated fields of chemical, physical, and geological oceanography to understand marine organisms.
Do you want to know more about how to interpret these satellite images? Explore this NASA video focused on the theme, "Why Ocean Color Really Matters" with NASA STEM professionals Dr. Jeremy Werdell and Gary Davis. Follow the link to learn more about the PACE Mission https://ustream.tv/recorded/121578593
Find more information at https://pace.gsfc.nasa.gov.
- Advanced technical equipment/expertise required

