
Grade Level: 9-12
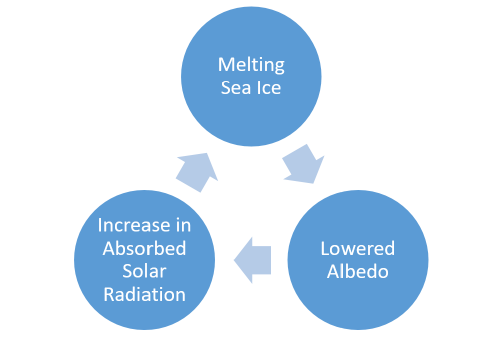
Students explore albedo, sea ice, and the relationship between changing albedo and changing sea ice using data visualizations.
Select a Sphere:


Students explore albedo, sea ice, and the relationship between changing albedo and changing sea ice using data visualizations.
Students will make a claim about whether changing albedo contributes to changes in Arctic habitats.
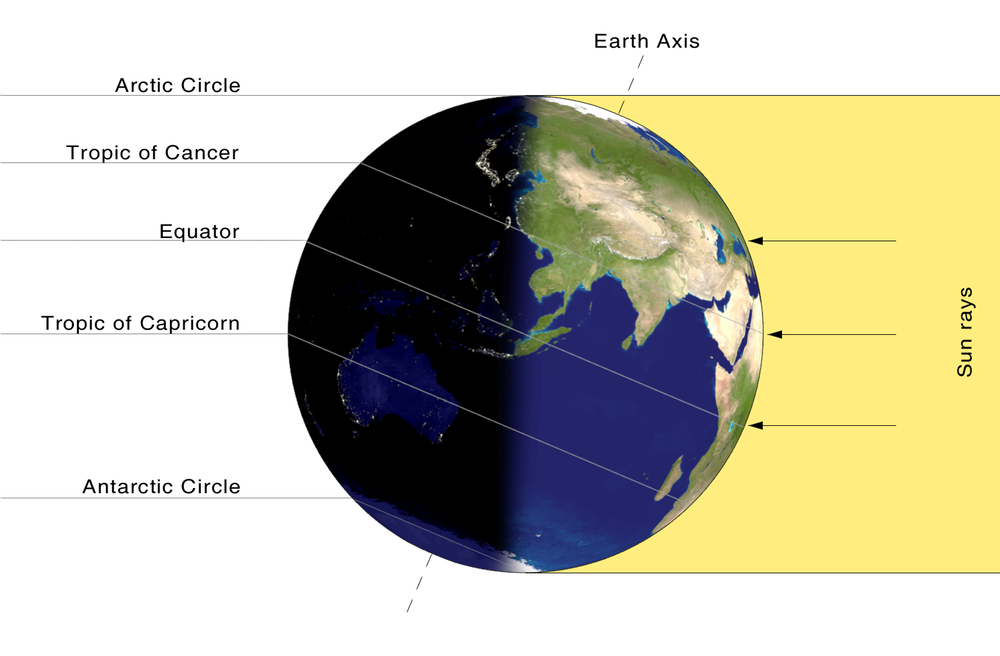
Students connect day/night and seasonal cycles with albedo in the Arctic region.
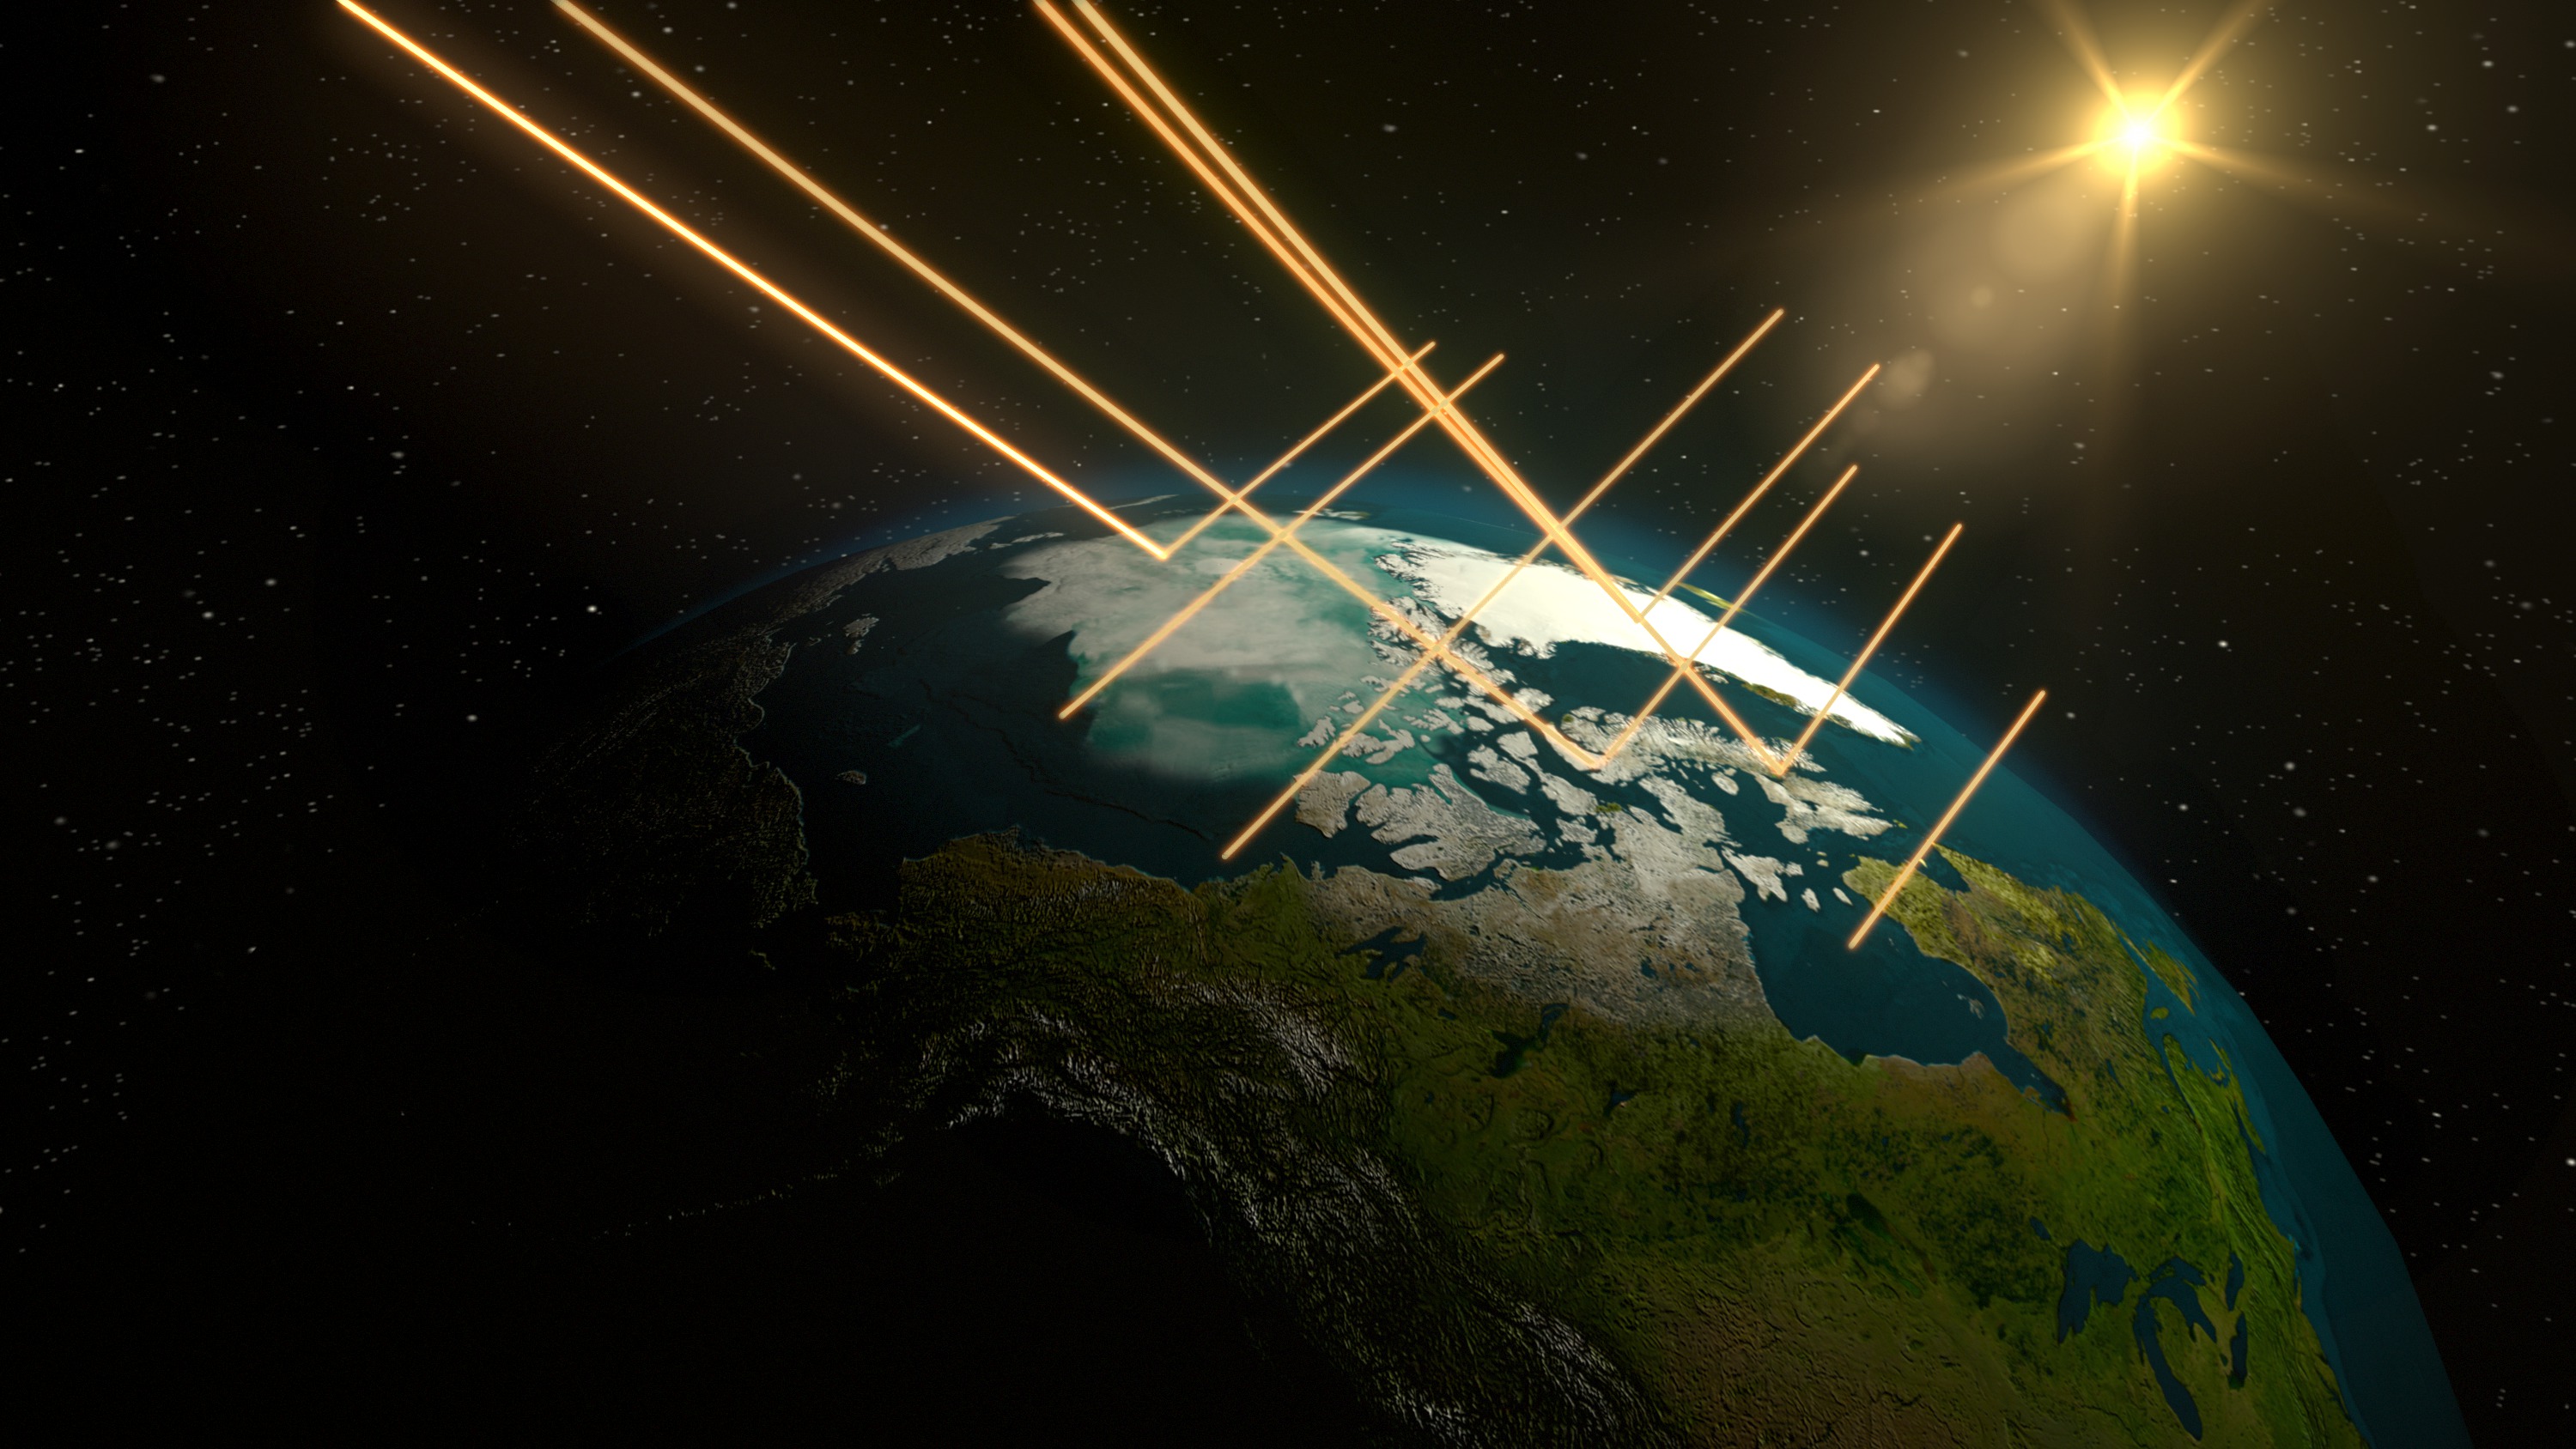
Students watch a video introducing the concept of albedo and answer questions.
Help learners envision themselves as explorers, scientists, technologists, engineers, and mathematicians as they venture into the summer months. Download the PDF of the two sided document on cardstock and have students imagine and illustrate themselves!
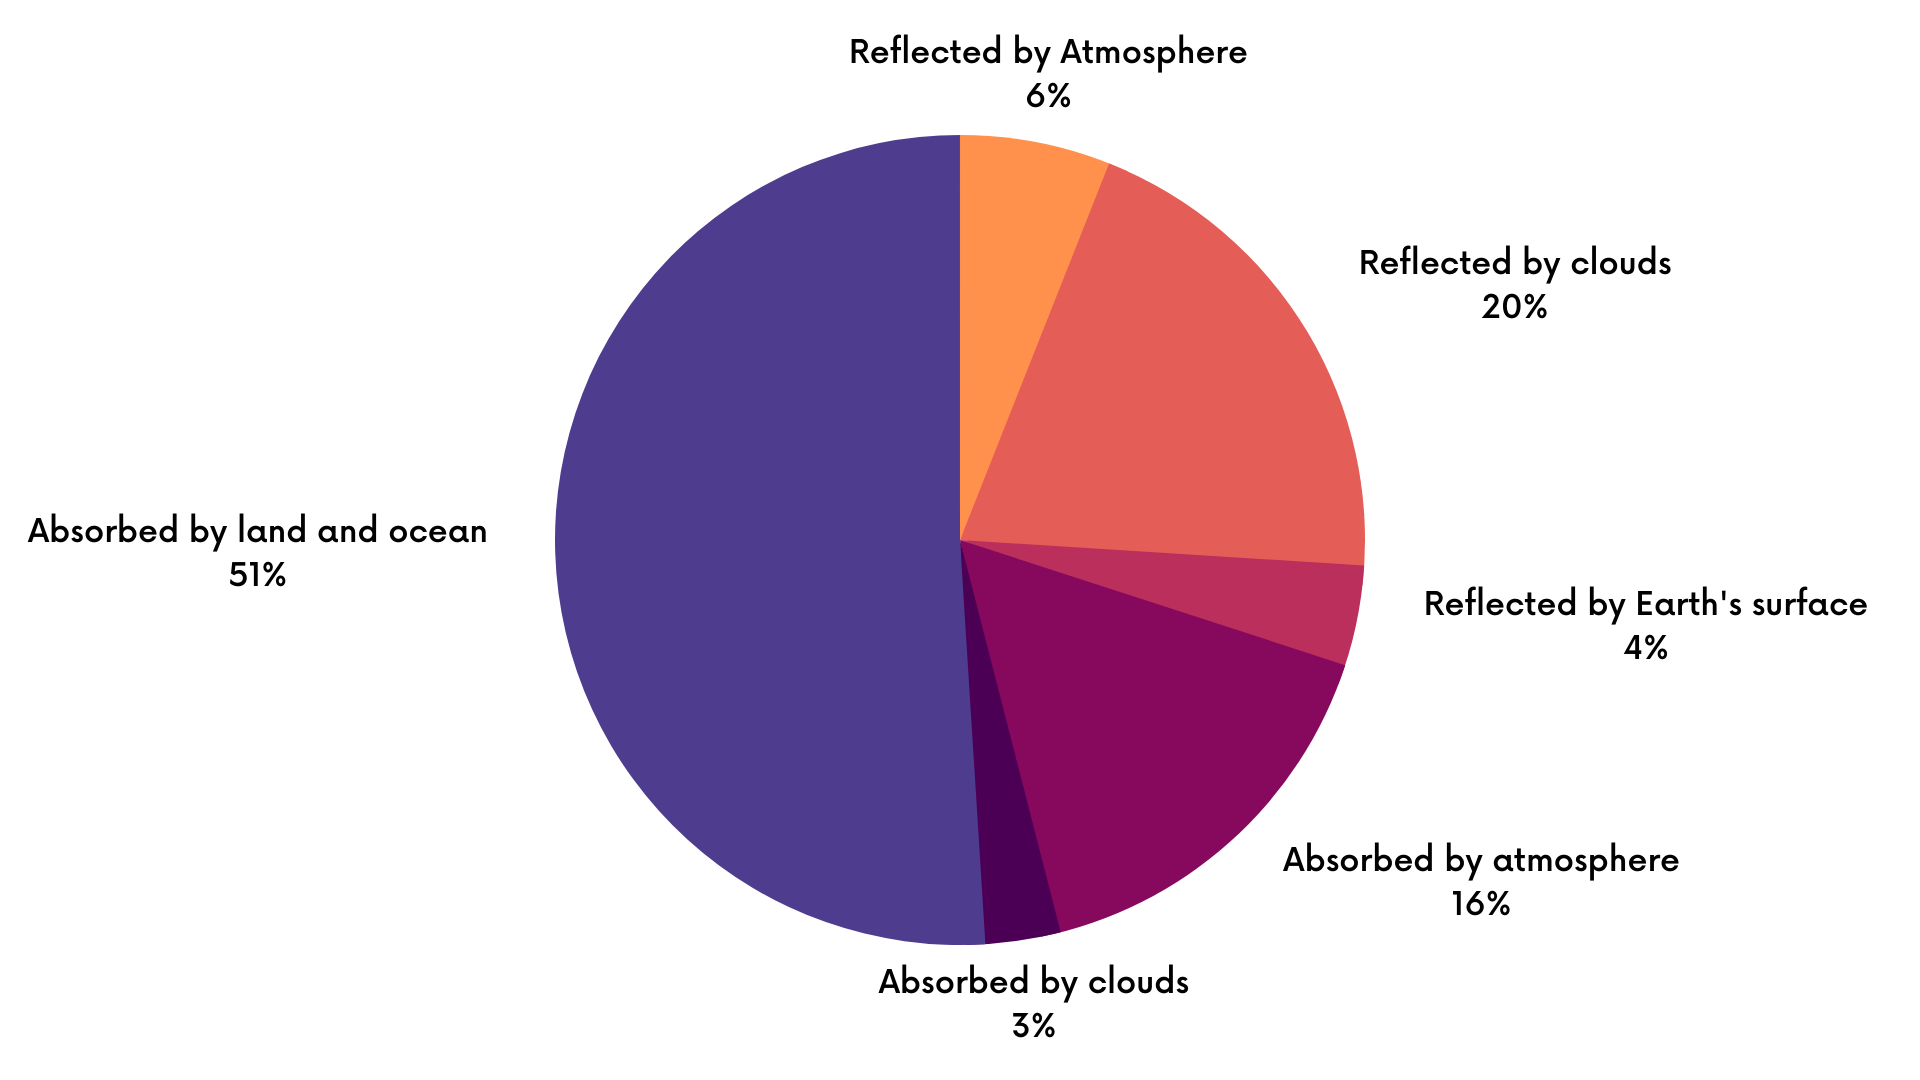
Students will analyze a pie chart (circle graph) showing the distribution of different parts of the Earth system's absorption and reflection of energy.
Students watch a video explaining albedo and its impact on Earth. The video shows visualizations of albedo across Earth and how it can change. Students will interpret the images in the video and answer questions about albedo.

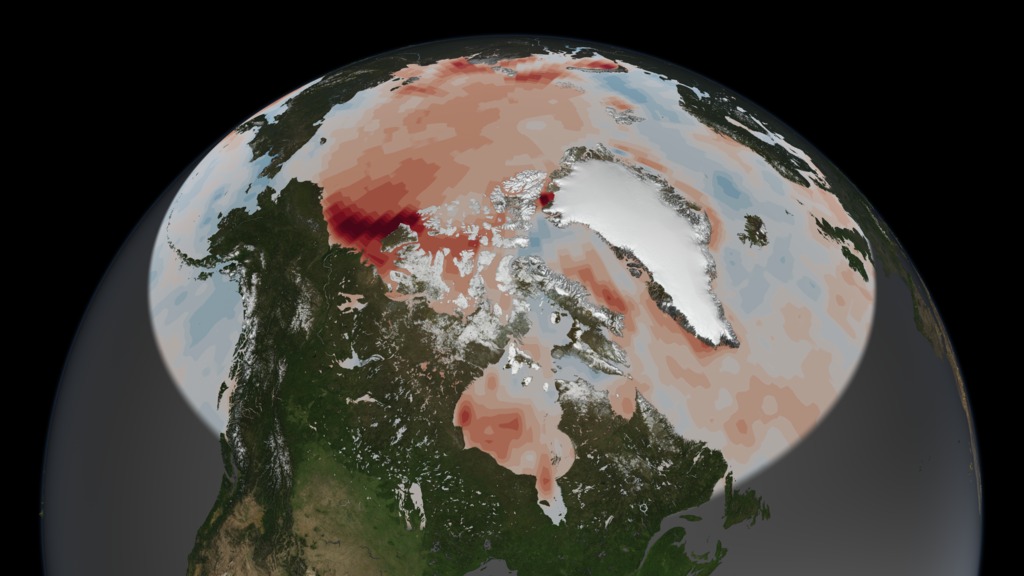
Students analyze two North Pole orthographic data visualizations produced from soil moisture data.
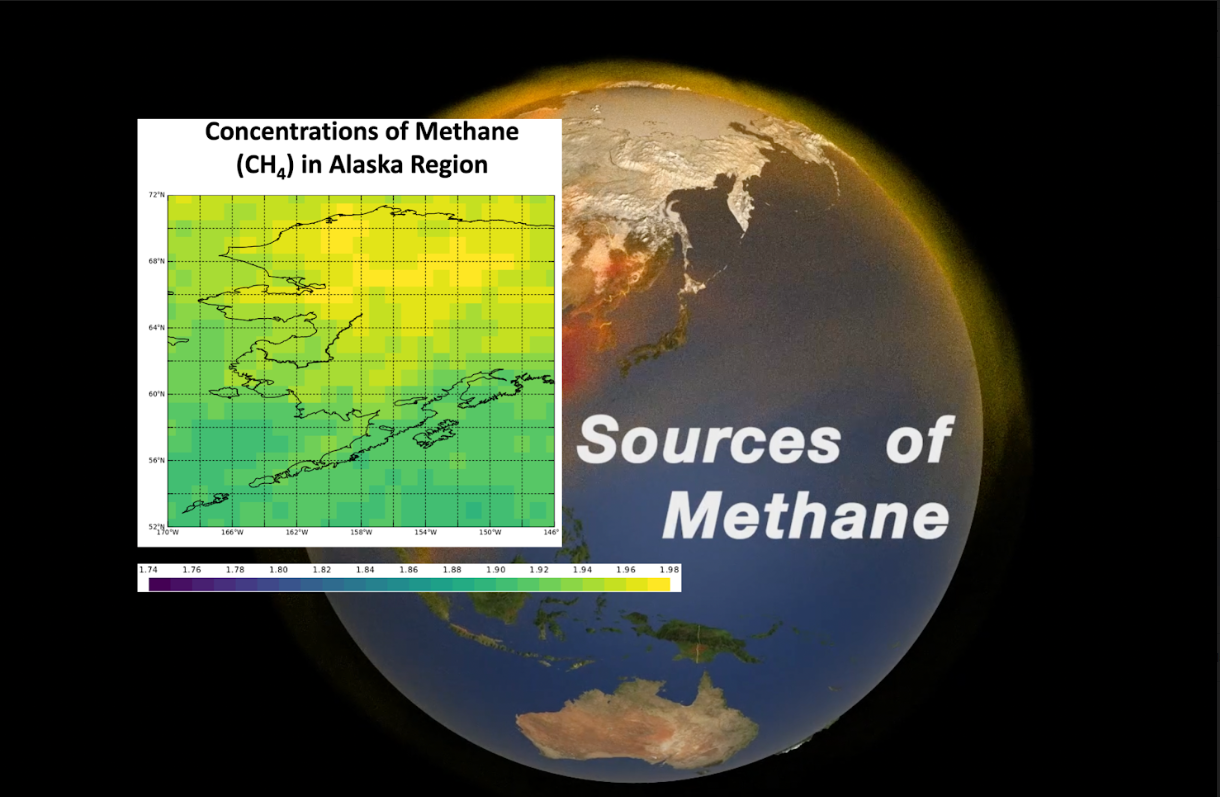
Students watch a short video to gather information about sources of methane emissions and then extend their understanding of these sources to evaluate monthly trends in the Alaska region, ultimately making connections to Earth’s energy budget.
Mini lessons are intended to be short engagement activities that teachers may assign as bell-ringers, exit slips, or parts of larger learning lessons. These include activities where students interact with NASA maps, graphs, and datasets from the atmosphere, biosphere, cryosphere, geosphere, hydrosphere and the earth system.
