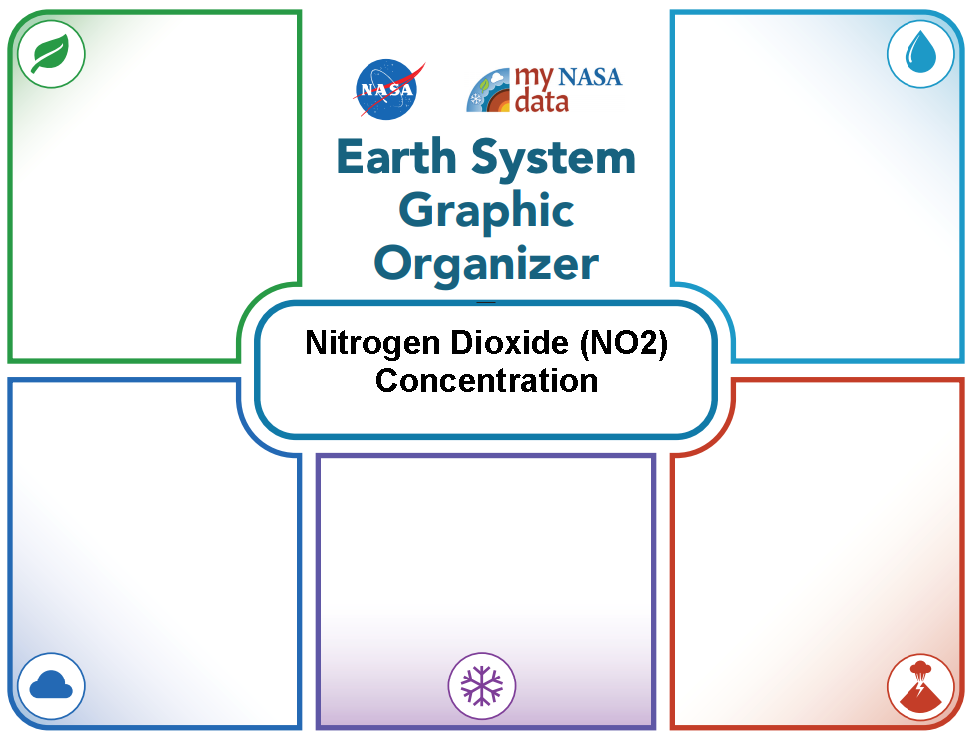
Students will explore the relationship between Nitrogen Dioxide and Precipitation in Earth's atmosphere. They will explore the data provided, make a claim, and complete a slide guided by a rubric.
List of all Atmosphere Data Resources
This Lesson Plan provides maps, graphs, and data tables for use with the Data Literacy Cubes. Because it is a differentiated resource, it is appropriate for multiple grade bands.
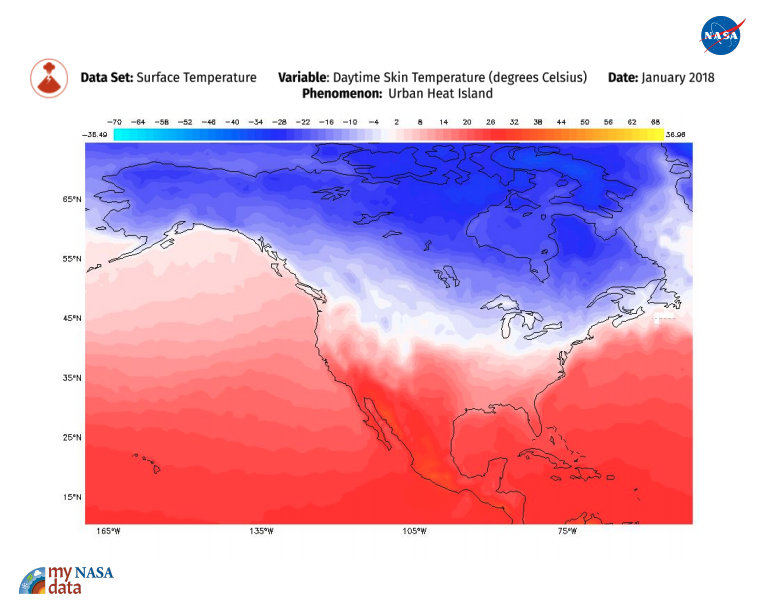
Teachers, are you looking for resources to help you engage students in data analysis related to the Urban Heat Island in North America?
The Earth System Satellite Images help students observe and analyze global Earth and environmental data, understand the relationship among different environmental variables, and explore how the data change seasonally and over longer timescales.
The My NASA Data visualization tool, Earth System Data Explorer (ESDE), helps learners visualize complex Earth System data sets over space and time.

Do you need instructions for how to use data from the Earth System Data Explorer in Microsoft Excel? Visit this link to access a step-by-step guide.
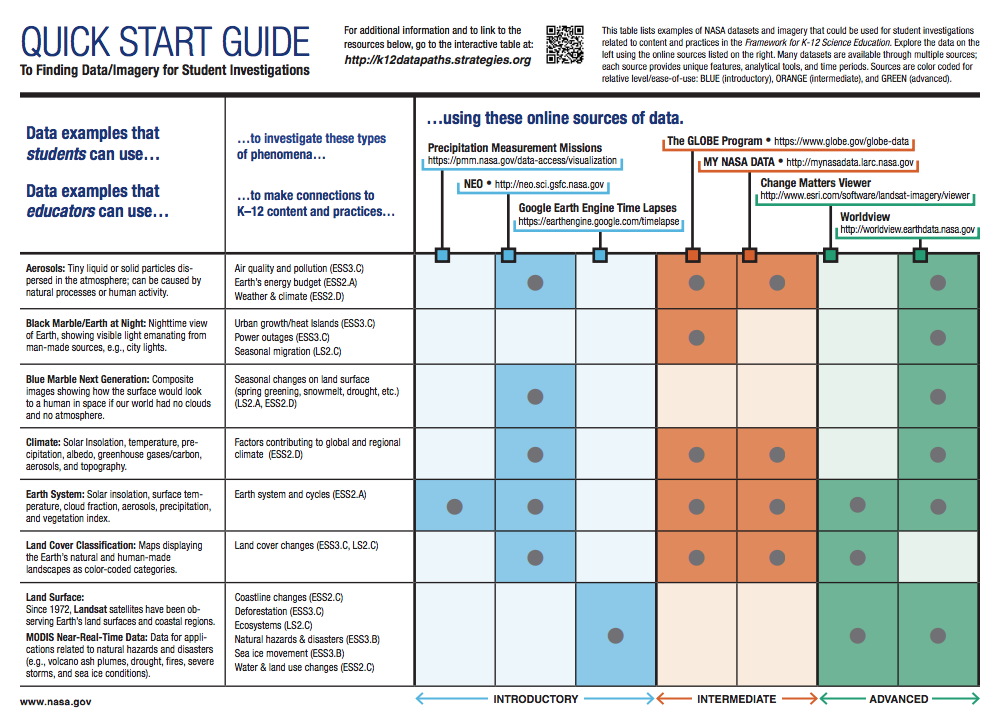
The Quick Start Guide lists examples of NASA datasets and imagery that could be used for student investigations related to content and practices in the Framework for K-12 Science Education.

Do you need tools to help using the Earth System Data Explorer? MND offers several ways to learn more about how to use this data visualization tool.
NASA visualizers take data – numbers, codes – and turn them into animations people can see and quickly understand.

Explore a variety of NASA resources.


