Grade Level: 3-5,
6-8,
9-12
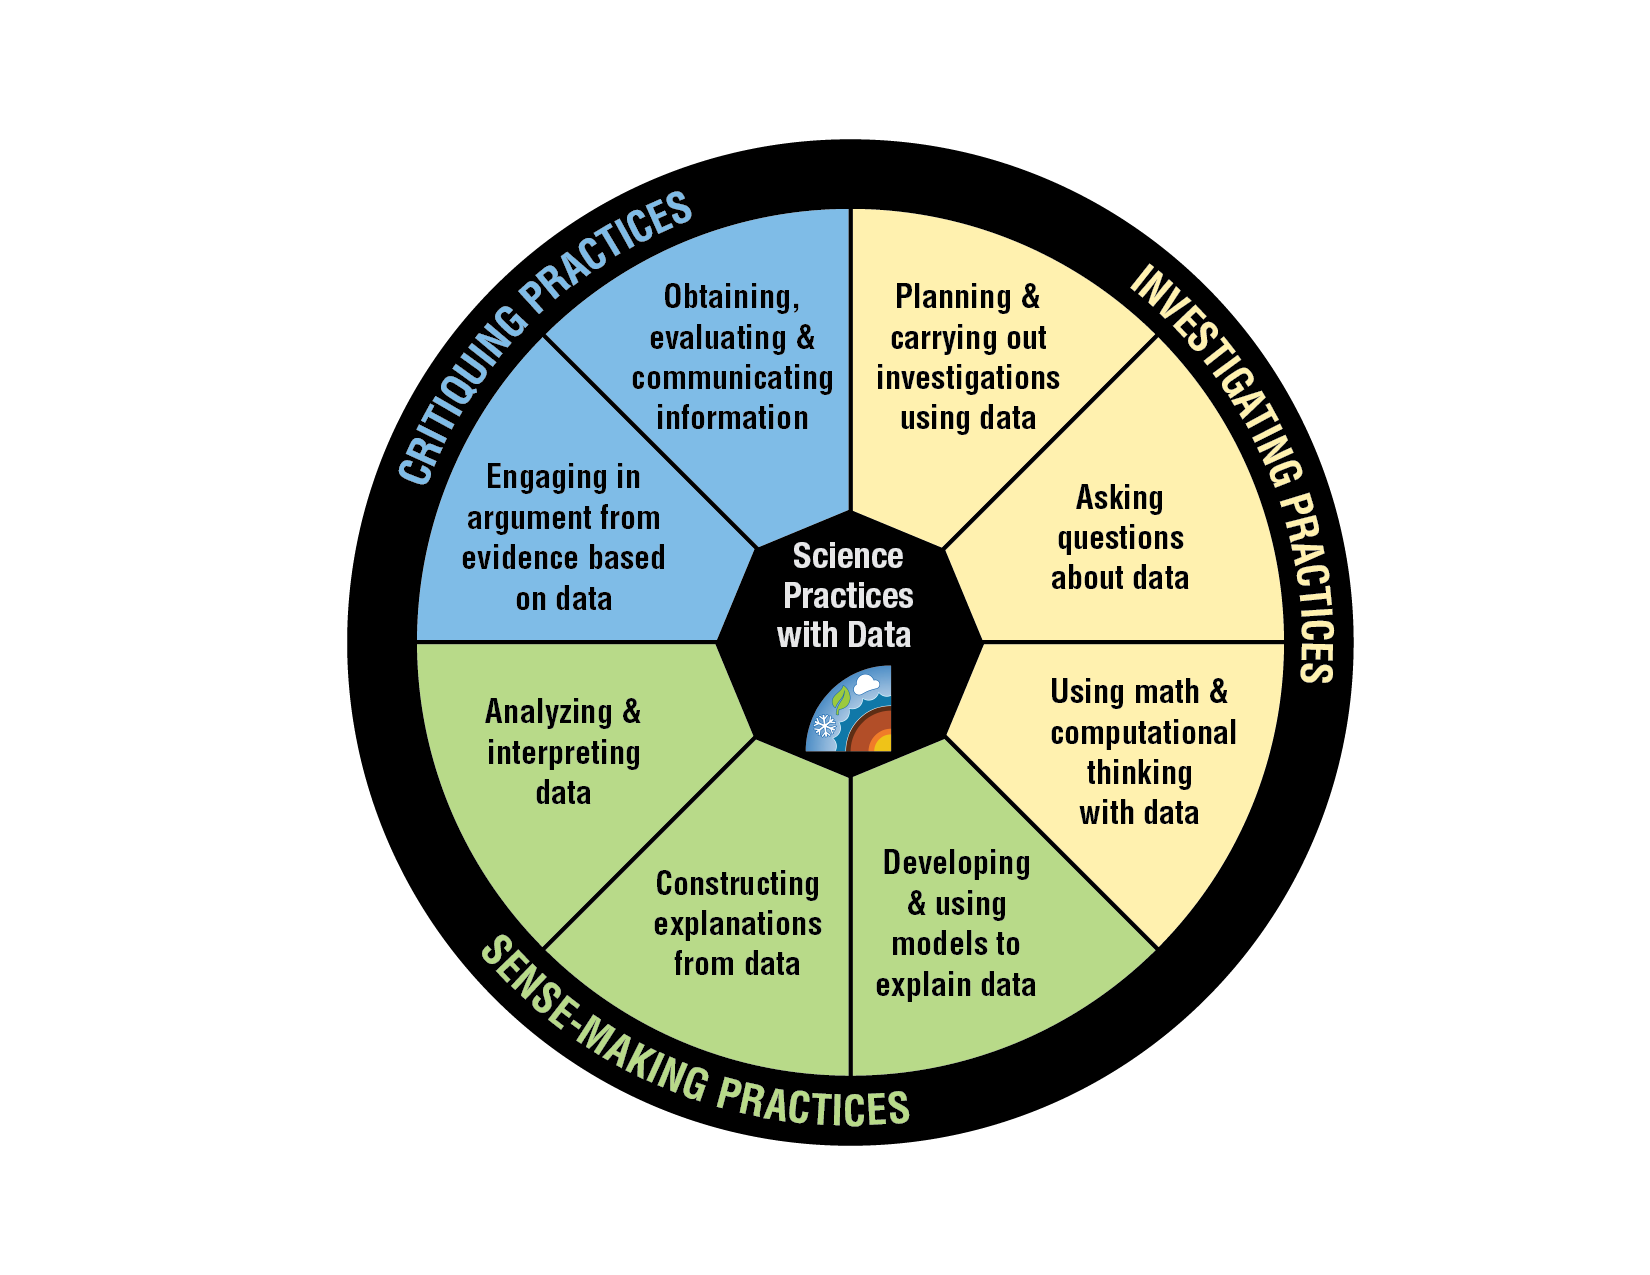
Are you searching for resources to use with your students related to Science and Engineering Practices? Review these graphics that will help to hone students' attention to the specific practices in science and how they relate to investigating, sense-making, and critiquing of data.