Mini Lesson/Activity
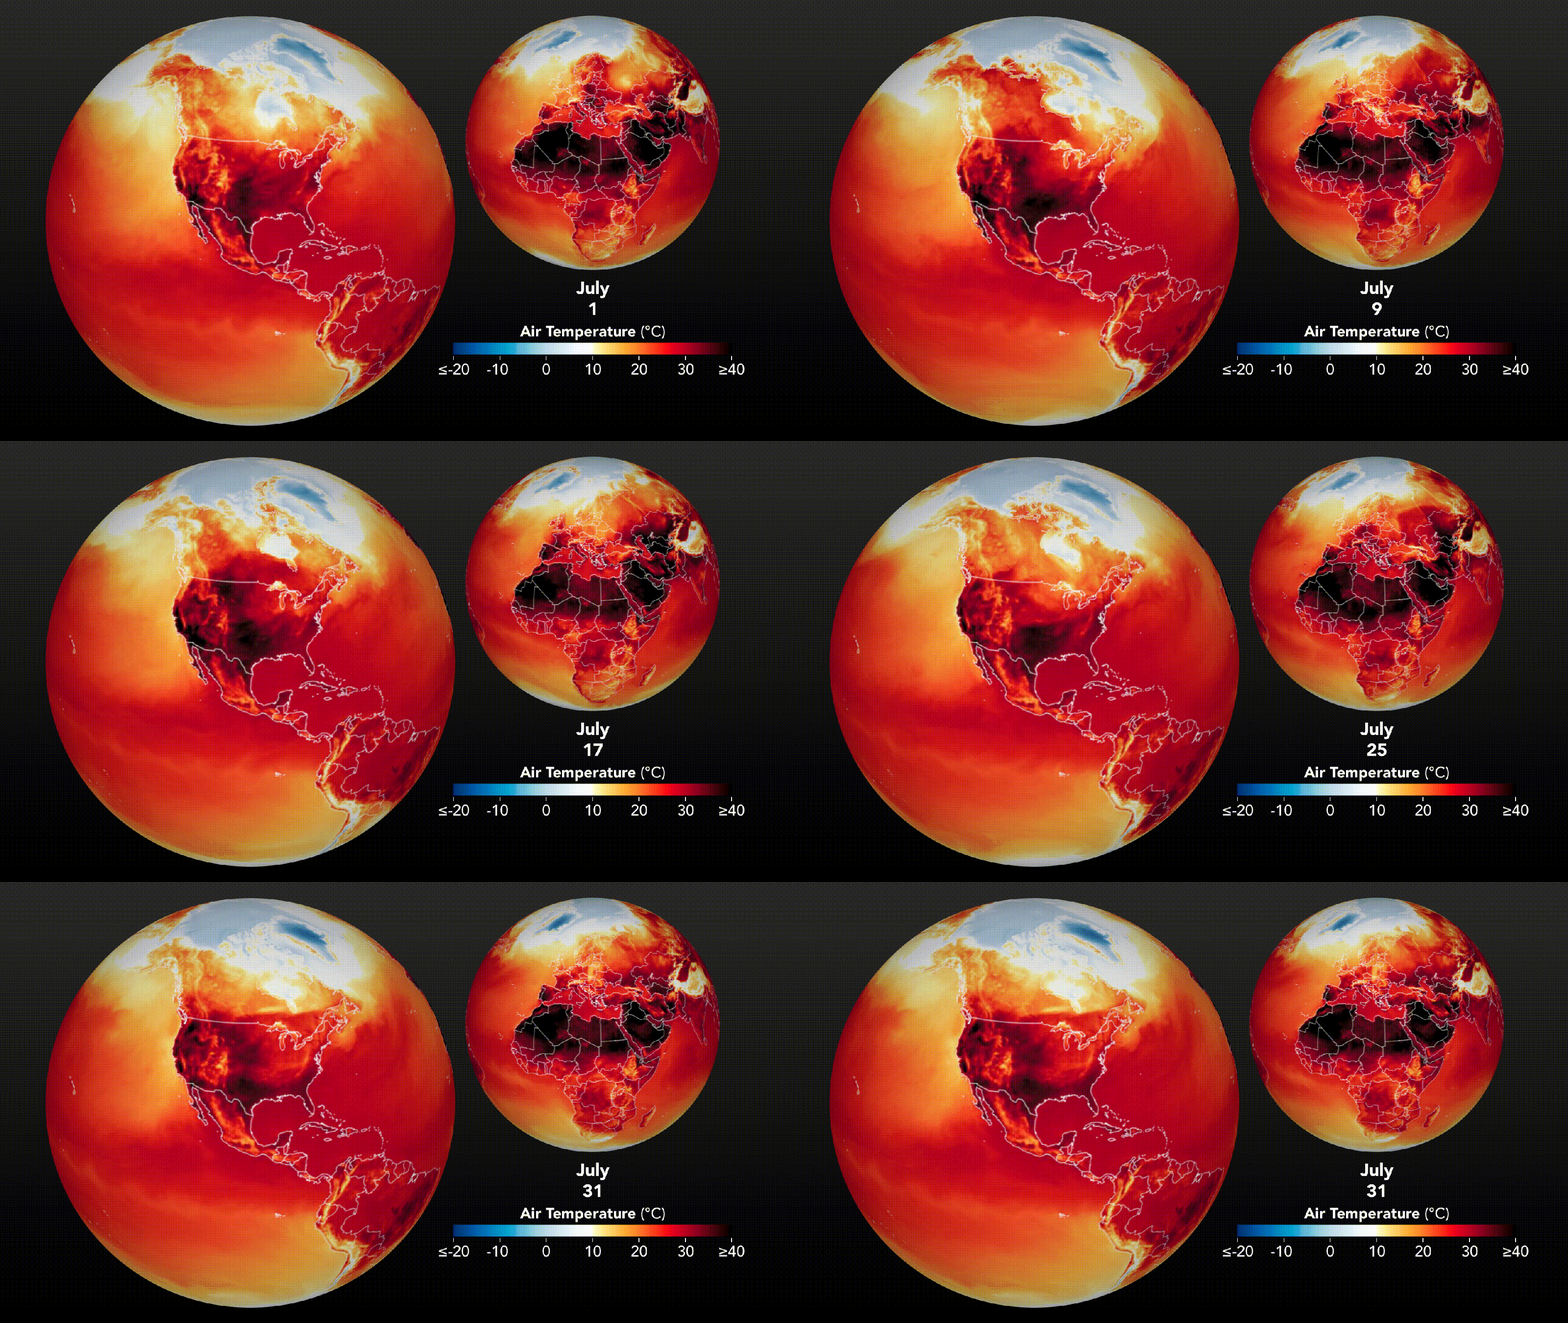
Extreme July 2022 Temperatures
Overview
By investigating the data presented in a model that displays extreme summer air temperatures, students explain energy transfer in the Earth system and consider the impact of excessive heat on local communities.
Student Directions
The month of July in 2022 was certainly one for the record books in terms of extreme heat in the United States. Extreme heat events lasting a few days to weeks at a time are occurring more frequently in major cities across the world and can have detrimental impacts on public health. NASA data can help forecast and monitor these events.
Review the article from NASA Earth Observatory and watch "July of Extremes," an animation of Daily Maximum Surface Air Temperature across most of the Western Hemisphere in July 2022. It was produced by combining satellite observations with temperatures predicted by a version of the Goddard Earth Observing System (GEOS) global model. The darkest red areas indicate temperatures of more than 104°F (40°C).

Steps:
- Check with your instructor on how to submit your answers.
- Describe the daily maximum air temperature in the continental United States during the month of July in 2022.
- Identify evidence provided in the animation that supports the claim that the July 2022 air temperatures in the United States were extreme and out of normal expected temperature ranges.
- Describe one impact excessive heat has on your local community.
- Describe one action you should take during times of excessive heat other than to simply moving indoors into climate-controlled conditions.
- Describe how the daily maximum air temperatures on the West Coast of the continental United States differ from the air temperatures immediately offshore over the Pacific Ocean.
- Use your knowledge of heat transfer to explain why the air temperatures over land are different than the air temperatures over nearby large bodies of waters.
- Identify a localized area/region in the continental United States where the air temperatures remained relatively cooler in July.
Sources:
- Pratt, S. E., Pawson, S., & Arnold, N. (2022, August 1). A July of Extremes. NASA Earth Observatory. Retrieved September 8, 2022, from https://earthobservatory.nasa.gov/images/150152/a-july-of-extremes
Teacher Note
This mini-lesson may be used to support student understanding of a commonly used model of Earth’s energy budget and clarify terminology used within the context of that model.
Students should have knowledge of the electromagnetic spectrum prior to this lesson.
Teachers, these mini lessons/student activities are perfect "warm up" tasks that can be used as a hook, bell ringer, exit slip, etc. They take less than a class period to complete. Learn more on the "My NASA Data What are Mini Lessons?" page.
Teachers who are interested in receiving the answer key, please complete the Teacher Key Request and Verification Form. We verify that requestors are teachers prior to sending access to the answer keys as we’ve had many students try to pass as teachers to gain access.
Disciplinary Core Ideas:
- ESS2A: Earth Materials and Systems
Crosscutting Concepts:
- Scale, Proportion, and Quantity
- Systems and System Models
Science and Engineering Practices:
- Asking Questions and Defining Problems
- Developing and Using Models
- Analyzing and Interpreting Data

